


White Papers · Performance Consulting
Business problem · afterwards
The number moved. Now: what may anybody honestly say about why?
Learning metrics and business metrics
Evaluation and impact are two different activities carrying one name. What each one measures, who owns it, which instrument belongs to it, and why the difficulty of proving impact is a report on where the work started rather than a problem to be solved with a better questionnaire.
No. 11 · © 2026 Tulser
In this paper
“It worked” is four different claims.
The question
A result is being claimed for something that was changed. Is this a question about the instruction or about the business measure, which instrument belongs to which, and what may be said once the measure has moved?
For
Anyone who has to report on an intervention or read a report about one: line managers and directors, finance, quality and continuous improvement, internal audit, OD, HR business partners and L&D.
Read
32 minutes · with a worked case and a one-page instrument.
| 01 | Evaluation and impact are not the same word | Two vocabularies, two owners, and the boundary no inference crosses. |
| 02 | Learning metrics, and business metrics | LTEM for the instruction; the KPI you already report for the result. |
| 03 | Why the two got confused | Kirkpatrick’s ladder, the models that followed, and the level error underneath. |
| 04 | Or stop trying to prove impact at all | The strongest published argument against chasing business impact, and where we part from it. |
| 05 | It moved, or you moved it | Two ordinary facts that produce improvement from nothing. |
| 06 | Four designs you can actually run | None of them requires a control group you are not allowed to have. |
| 07 | The claim, in four sentences | What a defensible statement looks like, and the work each sentence commits you to. |
| 08 | The rollout that proved itself by accident | A worked case in which the design was free and nobody had noticed. |
| 09 | What this does not claim | Three limits, because the rest is not credible without them. |
| · | Run it yourself | Six lines, on the claim in front of you. |
Tulser · White Papers · Performance Consulting
Every organization can prove that it acted.
Almost none can prove that it
mattered.
Tulser · White Papers · Performance Consulting
01 · Two words
Evaluation and impact are not the same word
Sixty years of argument in this field rest on one conflation. Two different activities have been carrying one name, and almost every unanswerable measurement question is a symptom of it.
Learning metrics answer whether the instruction is any good. Can these people now make the decisions the work requires, and perform the tasks in something like real conditions? That is evaluation, it belongs to whoever designed the program, and there is a serviceable instrument for it.
Business metrics answer whether the result moved. Days to deliver, defects per thousand, incidents per shift, first-visit fix rate: the measure the organization already reports and already argues about. That is impact, it belongs to the line manager who owns the result, and the instrument is the measure itself. Nothing has to be invented.
These are different questions with different owners, different instruments and different timescales. Treat them as two rungs of one ladder and you get the last sixty years: a profession trying to climb from a satisfied room into a business result by inference, and a business unable to see why the climb should be believed.
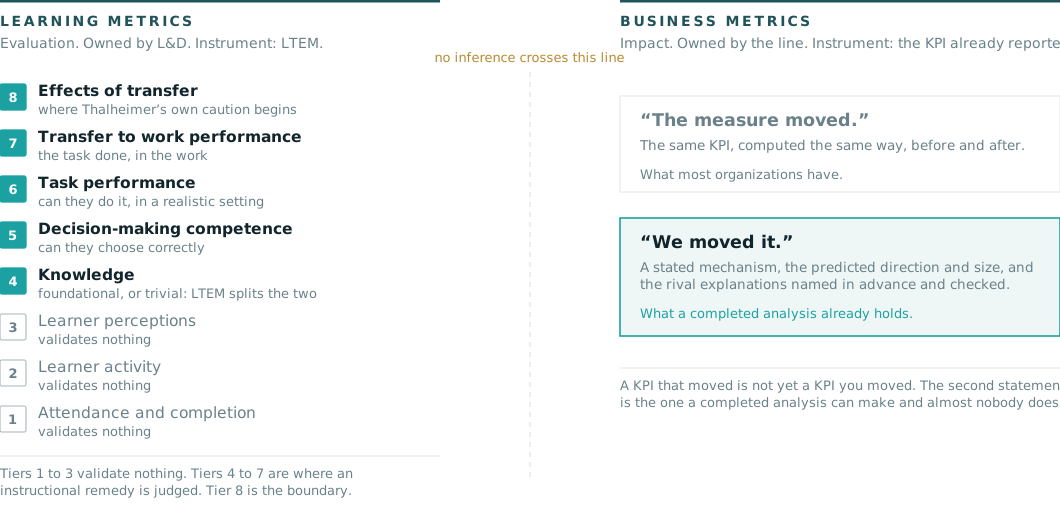
Two vocabularies, two owners, and a boundary no inference crosses. The right-hand
column has only two statements in it, and the distance between them is the whole of section 05.
Tulser · White Papers · Performance Consulting
02 · Learning metrics
Whether the instruction is any good
Sometimes the binding condition genuinely is knowledge and skill, and number 10 says so without hedging. Then the question is not whether the program moved the business. It is whether the program is any good, and that has an instrument.
Will Thalheimer’s Learning-Transfer Evaluation Model sets out eight tiers of evidence, and its usefulness is in the ordering. Attendance, learner activity and learner perceptions are the bottom three, and he is blunt that they validate nothing. Knowledge is the fourth and is split, because knowing a foundational concept and knowing a piece of trivia are not the same achievement. Decision-making competence is the fifth, task performance the sixth, transfer to work performance the seventh, and the effects of that transfer the eighth (Thalheimer, 2024).
The value for this series is precise. Number 09 establishes whether a knowledge-and-skill deficit is the binding condition; number 10 establishes that instruction is the remedy that can reach it. Neither says how you would know the instruction was well made. LTEM answers that, at tiers four through seven, and it does so without asking anybody to attribute a business result to a course.
The substrate, and the instrument for improving it
Individual learning is the substrate of a collective result and not the result itself: the destination piece of this series sets out the business models that convert it at the level of teams and the organization. LTEM is the right instrument for the substrate. It tells you whether people can now make the decisions and perform the tasks, which is exactly what has to be true before any collective conversion has anything to work on.
What it does not do, and Thalheimer does not claim it does, is carry a business claim. His eighth tier is where his caution begins and where this method takes over: from there the question is no longer about the program but about the conditions around the work, and that is numbers 09 and 10. [LTEM is a practitioner framework offered as an improvement on Kirkpatrick, not a validated model; it is used here as an instrument and not as evidence]
Tulser · White Papers · Performance Consulting
02 · continued
And business metrics, which you already have
Through the business door of this series the measurement problem barely exists, and that is not a happy accident. It is a consequence of where the work started.
Somebody named a result the organization already counts (number 05). Two values were established on it and the shortfall was cut three ways (number 06). Somebody already achieving it was found (number 07), and the binding condition was established (numbers 08 and 09). Afterwards you look at the same measure again, computed the same way. There is no evaluation framework to choose, no proxy to defend and nobody to convince that the number matters: the finance function has been reporting it for years.
Through the training door the same question is close to unanswerable, and that too follows from where the work started. A program acts on individuals; the result being claimed is produced by teams and held by the organization. No measurement design repairs that, because it is a fault in what was bought rather than in how it was counted.
Which makes the difficulty diagnostic
The measurement problem you have is a report on where you started. If proving that something worked feels impossible, read that as information rather than as a methods problem to be solved with a better questionnaire. It usually means the intervention was chosen before the result was named, and that the number now being hunted was never the number the work began with.
Which yields the shortest rule in this paper. When it is a business problem, use the business measure. When it is a learning intervention, evaluate the learning and stop there.
Tulser · White Papers · Performance Consulting
03 · Why the two got confused
The ladder that promised to connect them
The conflation has a name and a diagram. Kirkpatrick’s four levels (reaction, learning, behavior, results) put learning metrics and business metrics on one ladder and implied you could climb from the bottom to the top. That promise is the whole problem, and it is worth being precise about it, because the criticism is usually made carelessly and waved away.
Start with what the model actually is. In the late nineteen-fifties Donald Kirkpatrick named four kinds of outcome you could measure after training. As a list of four outcomes worth measuring it has never been bettered, and this paper does not try. It was not offered as a validated causal chain, and for a long time nobody read it as one.
What it acquired in practice is an arrow. The four became a ladder, and a good score at one level came to be treated as evidence for the next. That arrow is what has been coming apart for thirty-five years, and it has come apart further with each decade rather than less.
| When | What was established | What it did to the ladder |
|---|---|---|
| 1989 Alliger & Janak | The assumptions built into the four levels were examined against the studies that existed. The levels turned out to be far less strongly related to one another than the arrangement implies. | The first crack, and it was in the arrow rather than in the levels. |
| 1996 Holton | A published critique with a sharper charge: this is a taxonomy and not a model. It names four outcomes without specifying anything that intervenes between them, so it cannot be tested and it cannot diagnose. | Removed the arrow’s foundation. A ladder with no rungs specified is a list. |
| 1997 Alliger and colleagues | The relations among the criteria pooled properly. Whether participants judged the training useful related more strongly to learning and to transfer than whether they enjoyed it did. | Confirmed it quantitatively, and showed the ladder had the wrong reaction on the bottom rung. |
| 2021 Garavan and colleagues | Forty years of firm-level research, 207 studies: the effect of training cannot be separated from the system it sits in. | The top rung always has other causes, so it can never be inferred from the rung below. |
Thirty-five years, four independent lines, one target. None of them says the four
levels are worthless. All of them say the arrow between them is not there.
Tulser · White Papers · Performance Consulting
03 · continued
And the two objections that end the argument
Two more objections have landed, and either on its own would be enough. Together they make the ladder indefensible as a way of evidencing a business result.
The first is a level mismatch, and it is not a technicality. All four measures are taken on individuals: this person reacted, this person learned, this person behaves differently. The result the organization wants at level four is not an individual outcome. Safer handovers, fewer defects, reliable service, faster adaptation: these are produced by teams and held by the organization. So the ladder asks individual evidence to support a collective claim, and no amount of measurement care fixes that, because it is a design fault rather than a measurement fault. The distance between the two levels is real work (teams, embedding, maintenance) and no evaluation form crosses it. The next pages place the ladder among the models that followed it, and give this mismatch its name and its history.
The second is that the model’s own custodians have moved. The organization that carries Kirkpatrick’s work now teaches planning from level 4 backwards to level 1: begin with the result and the reason the program exists, then design towards it (Kirkpatrick Partners, 2026). That is not a defense of the ladder. It is its abandonment as a ladder, by the people with the most to lose from abandoning it, and it points in the same direction as this whole series: start at the result.
So what survives, and what to do instead
What survives is the list. The four outcomes Kirkpatrick named are four outcomes worth measuring, and the vocabulary he gave the profession was worth having. What does not survive is the inference from one to the next, and almost every claim that gets a function into trouble is an arrow rather than a level.
The instruction that follows is short. Measure each level as its own question, with its own evidence, and never quote one as though it settled another. Then decide before you start which claim you actually intend to make, and build the evidence for that claim rather than for the ladder. Section 07 sets out the form a defensible claim takes, and what it costs to say honestly.
Tulser · White Papers · Performance Consulting
03 · The models that followed
Every attempt starts with the learner
Since Kirkpatrick, the profession has tried again and again to show impact through individual learning. Each model adds something worth having. Almost all of them keep the same starting point.
| Model | What it adds | Where it stops |
|---|---|---|
| Kirkpatrick, 1959–1960 | Four outcomes: reaction, learning, behavior, results. His 1956 article credited the four steps to Raymond Katzell (Thalheimer, 2018). | Results, read in practice as the top of a ladder |
| Warr, Bird & Rackham, 1970 | CIRO: context and input are evaluated before reaction and outcome | Outcomes for the organization |
| Hamblin, 1974 | Five levels: the organization and its “ultimate value” as separate rungs | Ultimate value |
| Kaufman & Keller, 1994 | Input and process split out, and a fifth level: the contribution to society | Society |
| Phillips, 1997 | Return on investment as a fifth level, after isolating the effect of the program | A monetary return |
| Brinkerhoff, 2003 | Success Case Method: the best and worst cases instead of the average, and what made the difference | Cases of success and non-success; no average claim |
| Kirkpatrick & Kirkpatrick, 2016 | Planning from results backwards, with the “required drivers” in the work | Results, with the work environment in view |
| Thalheimer, LTEM 2018 | LTEM: eight tiers, from attendance to the effects of transfer | Transfer and its effects; he warns against chasing impact (Thalheimer, 2025) |
Most models add a rung above the individual. The evidence still enters at the bottom, in the learner. Brinkerhoff and Thalheimer are the two that deliberately stop short of an average claim about the organization. Kraiger, Ford and Salas (1993) refined the learning rung itself into cognitive, skill-based and affective outcomes, and stayed at that level.
Tulser · White Papers · Performance Consulting
03 · The models that followed, continued
Eight models, one entry point
Set side by side, the models differ in how high they reach. They do not differ in where the evidence enters.
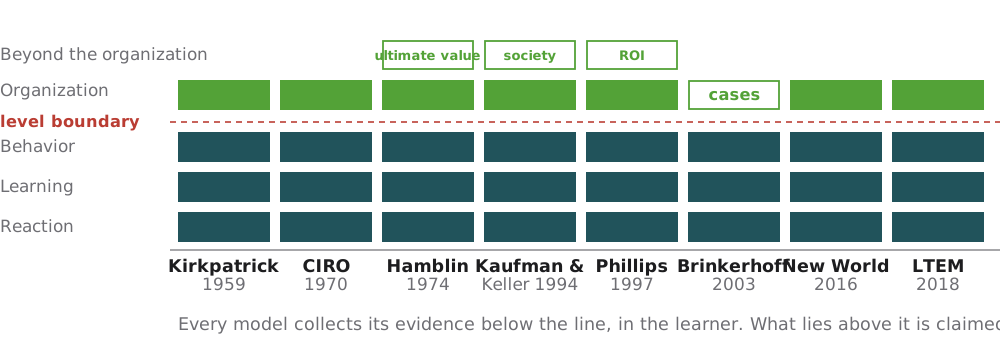
Every column rests on three rungs measured in the learner: reaction, learning and behavior. Above the dashed line the models differ. Most add the organization as a rung; Hamblin, Kaufman and Keller, and Phillips add a further one beyond it. Brinkerhoff looks above the line only through individual cases, and deliberately not through an average. What none of them does is measure a team or an organization as a unit. That is the gap the next pages name.
Tulser · White Papers · Performance Consulting
03 · The level error
The level error underneath the ladder
The mismatch named two pages back has a name in organizational research, and a long history. The level error draws a conclusion at one level from evidence gathered at another.
Robinson (1950) showed that correlations between groups cannot stand in for correlations between individuals. The reverse fails as well: data on individuals do not reveal how groups differ, which epidemiologists call the atomistic fallacy (Diez Roux, 1998). Rousseau (1985) and Klein, Dansereau and Hall (1994) turned this into a rule for organizational research: the level of the theory, of the measurement and of the analysis must match.
Kozlowski and Klein (2000) then described how properties of a team or an organization emerge from individuals. By composition, similar individual properties combine into a shared one. By compilation, different contributions form a pattern that exists only at the higher level. For training, Kozlowski and colleagues called the move from individual outcomes to team and organizational outcomes vertical transfer, and treated it as something to design for rather than to assume (Kozlowski et al., 2000).
Why it undermines the ladder
- The result is often a pattern, not a sum. Safe handovers, reliable service and low defect rates depend on how contributions fit together. Ten people who each learned more do not add up to that pattern by themselves (Kozlowski & Klein, 2000; Ployhart & Moliterno, 2011).
- Context decides what reaches the result. Whether individual gains count depends on the work around them: coordination, tools, incentives. The ladder has no place for that, which is why firm-level research keeps finding that training cannot be separated from its system (Garavan et al., 2021).
- The inference fails both ways. A positive effect in individuals does not show an effect on the organization, and its absence does not rule one out. Where results emerge by compilation, a team can change how it works together while individual scores barely move.
Tulser · White Papers · Performance Consulting
03 · The level error, in one picture
The ladder against how results emerge
On the left, the inference the ladder makes. On the right, the two ways a result at a higher level actually comes about.
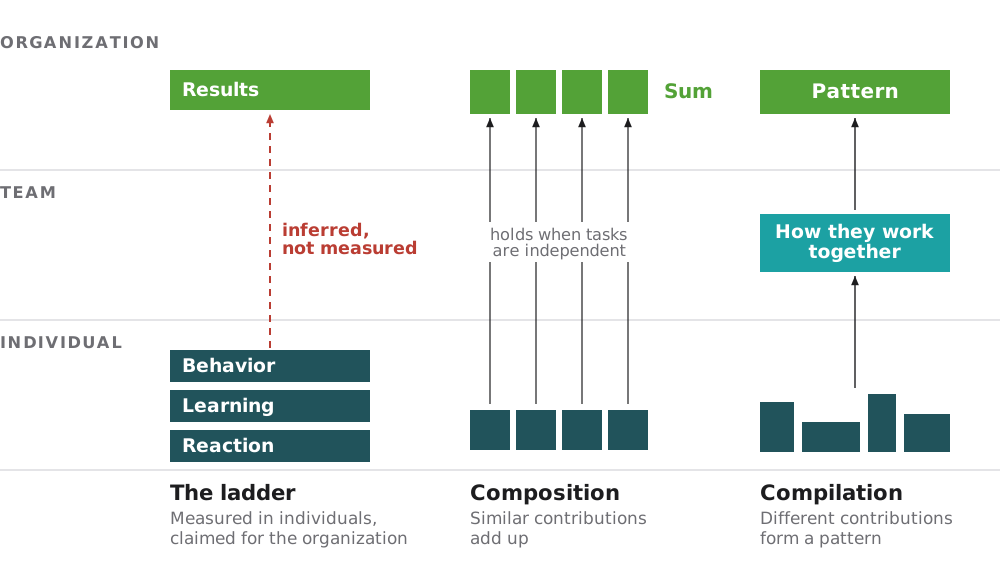
The ladder measures three rungs in individuals and infers the fourth for the organization. Composition is the case where that inference comes close: similar contributions, independent tasks, a result that is roughly their sum. Compilation is the case where it fails: different contributions that only produce the result through how people work together, so the result exists only at the higher level and has to be designed and measured there (Kozlowski & Klein, 2000).
Tulser · White Papers · Performance Consulting
03 · The level error, continued
What the level error says, and what it does not
The level error is easy to overstate. Four limits keep it honest.
- Where adding up holds. When people work side by side on independent tasks, such as agents who each handle their own calls, the result of the unit comes close to the sum of individual results. That is composition, and there the error is small.
- The error lies in the inference, not in the measurement. Measuring individuals remains worth doing. The four outcomes Kirkpatrick named survive as a list; what fails is the step from one level to the next.
- Organizational effects of training exist. Across 159 studies, training relates to organizational performance, weakly and with wide variation by context (Kim et al., 2025). What fails is the route of proof, not the possibility of an effect.
- Isolation is sometimes possible. Phillips’s methods for isolating effects, and the designs in section 06, can show an effect at the level of a unit when conditions allow. They then measure at that level, which is the point.
What follows
Measure each claim at its own level: evidence from individuals for claims about individuals, team and organizational measures for claims about teams and organizations, each with a design that fits that level (Sitzmann & Weinhardt, 2019). Studying how results emerge over time asks for designs that follow people and teams across time, not a single measurement afterwards (Kozlowski et al., 2013).
And start where the claim will be made. If the result belongs to the organization, the diagnosis and the design start there too. No. 16 in this series shows what L&D can show before a training starts, at the level where finance keeps its numbers.
Tulser · White Papers · Performance Consulting
A number that moved
is not yet a number you moved.
Tulser · White Papers · Performance Consulting
04 · The other conclusion
Or stop trying to prove impact at all
There is a serious argument, made from inside the profession, that the whole pursuit of business impact is a mistake. It deserves a hearing rather than a footnote, because on its own ground it is largely right.
Will Thalheimer sets out ten reasons not to measure impact. Four of them bite hardest. Measuring impact costs a great deal, and the money spent proving a program worked is money not spent making it work. A function measuring its own success is open to bias and to the suspicion of bias, whatever the design. Learning spend is small enough that it does not register against the scale of organizational funds, so the number nobody asked for is also a number nobody weighs. And impact evidence has never been observed to save a function from a cost review anyway (Thalheimer, 2025).
His conclusion is that learning professionals have far more influence over learning than over organizational outcomes, and should spend their effort where that influence is. That is not defeatism. It is a correct reading of where a training function actually stands.
Where we agree, and where the two positions part
We agree with the diagnosis and with nine of the ten reasons. The tenth, that science has already demonstrated the benefits of training, is the one we cannot accept as stated, and number 02 says why: what the firm-level syntheses show is that training effects cannot be separated from the system they sit in, which is a weaker claim than it is usually made to carry.
The remedy is where the two positions separate, and the separation is the two doors again. Thalheimer is addressing a function that has already been handed a program and is being asked to prove it paid. Given that starting point he is right: stop trying. This series addresses the moment before that, and says something he does not contradict, if a business result is what you want, do not start with a learning intervention. Start with the measure. Then nobody has to prove impact afterwards, because impact was the question the work opened with.
Tulser · White Papers · Performance Consulting
05 · The two facts
Two ordinary facts that fake a result
Before any question of design, two statistical facts produce improvement out of nothing at all. Both are entirely mundane, both are well documented, and between them they account for a great many celebrated successes.
Regression to the mean. Unusually extreme measurements tend to be followed by measurements closer to the average, and the effect is larger the noisier the measure and the more the group was selected on its extreme values. Read that second clause slowly, because it describes standard practice: the organization identifies its worst-performing region, team or branch, intervenes there, measures again, and finds improvement. Some of that improvement was going to happen with no intervention whatever, and it is a property of arithmetic rather than of the remedy.
Selection. Who ends up in the measured group is rarely random, and the way people arrive in it can produce an apparent effect that has nothing to do with what was done. In an organizational setting it arrives in three ordinary forms: people who volunteer for a program differ from those who do not; people who leave before the post-measurement are not in it; and the sites that agreed to go first were the sites that were readier.
| What was done | What it looks like afterwards | What is actually needed |
|---|---|---|
| Intervened in the worst-performing unit | A large improvement, larger than anywhere else. | The same units’ history over several prior periods. If the worst unit has bounced back before, expect it to again. |
| Ran the program for volunteers | Participants outperform non-participants, substantially. | A comparison against people who wanted to attend and could not, not against people who chose not to. |
| Measured only those who completed | Excellent results among completers. | The result for everyone who started, including those who left. The dropouts are data, not noise. |
| Rolled out to the willing sites first | Early sites do better, which reads as proof of the remedy. | The order of rollout recorded and the early sites’ prior trend examined. Readiness travels with willingness. |
Four situations, all ordinary, all producing an apparent effect with no
intervention required. The third column is cheap and almost never done.
Tulser · White Papers · Performance Consulting
06 · The designs
Four designs you can actually run
The counterfactual is usually unavailable. It is not always unavailable, and the situations that supply one for free are more common than they look: most of them created by operational decisions nobody thought of as research.
| Design | When you already have it | What it needs, and what it will not survive |
|---|---|---|
| Interrupted time series | You have a routine measure reported monthly for at least a couple of years, and the change has a date. | Enough points before and after to establish both the level and the slope. It will not survive a second change made in the same month, which is the usual killer. |
| Difference-in-differences | The change reached some units and not others, for reasons unrelated to their performance. | Comparable prior trends in both groups, shown rather than assumed. Where units were treated at different times the simple comparison is misleading, and an analyst who knows why should do the arithmetic. |
| Stepped rollout | You are deploying in waves anyway, because you cannot do everything at once. | The order set in advance and not by readiness. Where the readiest sites go first, the early evidence flatters the remedy and there is no repairing it afterwards. |
| Regression discontinuity | Something was allocated by a threshold: a score, a tenure band, a size cut-off. | A genuine rule, actually applied. Where people negotiate their way across the threshold, the comparison is no longer between like and like. |
Four designs, and the second column is the point: in most organizations one of
these is already true and nobody has noticed it in time to preserve it.
Which gives the single highest-yield instruction in this paper, and it costs nothing. Decide the evaluation design before the rollout, not after. A phased deployment whose order is recorded in advance is a usable design; the identical deployment with the order lost is a before-and-after with a story attached. The difference is one email, sent a month earlier.
Tulser · White Papers · Performance Consulting
07 · The claim
Contribution rather than attribution
Where no design is available, which is most of the time, there is still a disciplined way to make a defensible claim. It is not a technique so much as a form of words that commits you to work.
The claim is that the intervention contributed: that it was one cause among others, that the mechanism by which it would have worked was stated in advance, and that the change observed is consistent with that mechanism and not better explained by something else. That is the second of the two statements on the business side, and it is precisely what a completed cause analysis is already holding: a stated condition, a stated remedy, and a prediction about which number would move and roughly by how much.
The discipline is in the second half of the sentence. A contribution claim is worth nothing unless the rival explanations were named in advance and examined. Which rivals, in an ordinary organization? The market moved. A second change landed in the same quarter. The measure’s definition changed. The comparison period was unusual. The people who were measured are not the people who started. Each of those is checkable from records the organization already holds, and a contribution claim that does not visibly check them is a story with a diagram attached.
The form a defensible claim takes
Four sentences, in this order. We established that this condition was binding, and predicted that changing it would move this measure by roughly this much. We changed it on this date and the measure moved by this much. These four rival causes could also have produced that movement, and here is what each of them would have looked like instead. On that basis we judge that our change accounts for the larger part of it, and the remainder is the trend.
Nothing in those four sentences requires a statistician. All four require somebody to have thought about the answer before the question arrived, which is the part that cannot be added at the end. And the second sentence has a precondition number 14 spells out: before judging whether the measure moved, establish that the change actually arrived in the work (adopted, as designed, by the people it was meant for). A verdict on a remedy that was never installed judges nothing but the rollout.
Tulser · White Papers · Performance Consulting
The design was already there.
Nobody had written down the order.
Tulser · White Papers · Performance Consulting
08 · A worked case
The rollout that proved itself by accident
A retail bank, 214 branches. A change to the mortgage application handover (a fixed form traveling with the file, replacing a phone call) was deployed over nine months because the training and system work could not be done everywhere at once.
The measure was applications reaching the underwriter complete: 68 percent before, required 90. After the full rollout it stood at 81. The report that was drafted said the change had delivered thirteen points. That is the measure moved written as we moved it, and it was wrong in three ways.
| The problem | What it would have done to the claim |
|---|---|
| The trend was already rising | Completeness had moved from 61 to 68 over the four quarters before the change, with nothing done. Two to three of the thirteen points belong to a trend that was already running. |
| The order was not random | The first wave was 40 branches chosen by regional managers as the ones that would cope. Their prior completeness averaged 74 against 66 for the rest, so the early evidence was always going to look better. |
| A second change landed in month six | The application system was upgraded nationally, which removed two free-text fields. It affects the same measure and it was not ours. |
Three problems, all discoverable from records the bank already held, and all
fatal to the claim as originally drafted.
None of that made the change worthless. It made the first version of the claim indefensible, which is a different thing and a recoverable one.
Tulser · White Papers · Performance Consulting
08 · continued
What the rollout turned out to be
The nine-month deployment was, without anybody intending it, a phased design. The order had been recorded (in a project plan, for scheduling reasons) and that record was the whole asset.
Branches that had received the change could be compared against branches that had not yet received it, in the same months, with the pre-existing difference between the two groups measured rather than assumed. The system upgrade in month six landed on both groups simultaneously, so it moved both and did not explain a difference between them. And the rising trend was present in both, so it likewise could not account for the gap between them.
| The claim | What the evidence supported |
|---|---|
| As drafted | “The handover change delivered 13 points of completeness.” A we-moved-it sentence on an it-moved evidence base. |
| As published | “Branches with the change ran 7 to 9 points ahead of branches without it, in the same months, having started 8 points apart in the other direction. The rising trend and the system upgrade affected both groups. We judge the change contributed the larger part of the improvement, and the trend the remainder.” A contribution claim, evidenced. |
Half the headline, and it survived the finance director, who had asked the
branch-order question in the first meeting.
The instructive part is what it cost. Nothing was measured that the bank was not already measuring. The only thing that made the stronger claim possible was that somebody had written down the order of the waves nine months earlier, for reasons that had nothing to do with evaluation. That is the whole of the practical advice in this paper.
Tulser · White Papers · Performance Consulting
09 · The limits
What this does not claim
This paper raises the evidence standard. That has costs, and pretending otherwise would be the same error in the opposite direction.
- Rigor has a price and it is not always worth paying. A change that cost two days of an analyst’s time does not need a quasi-experimental design. The standard should scale with what is at stake: the measure moved is fine for a small change nobody will cite, and the second statement is required the moment the result is used to justify further spending.
- The four designs come from other fields. Interrupted time series, difference-in-differences, stepped rollouts and threshold comparisons are established in epidemiology and econometrics, and they are described here at the level a practitioner needs rather than at the level an analyst does. Where the stakes justify it, get somebody who knows the arithmetic.
- A contribution claim is not a certificate. It is a disciplined way of reasoning towards a defensible statement, and two competent people applying it to the same case can still disagree about how much of the movement to attribute. What it rules out is the undisciplined version, which is most of what gets published internally.
Summary
“It worked” hides four different claims: the measure moved; we changed something; our change contributed to the movement; our change produced it alone. Most organizations hold the evidence for the second and publish the fourth. The third (a stated mechanism, the rival explanations named and tested) is reachable from records the organization already has, and it is what a completed analysis leaves behind. The single highest-yield act is deciding the design before the rollout, which usually costs one email.
Tulser · White Papers · Performance Consulting
Run it yourself
Six lines, on the claim in front of you
Twenty minutes, on a result somebody is about to report. Line one decides how much of the rest you need, and line six is the one that should have been done first.
1 · Which of the two statements is the claim written as
“The measure moved”, “we contributed”, or “we caused it”? Read the actual sentence, not the intention behind it.
2 · Which of them does the evidence reach
What exists: an attendance list, a before and after, a mechanism with rivals tested, or a counterfactual? Compare with line one.
3 · The prior trend
Plot the measure for four quarters before the change. Was it already moving, and in which direction? Subtract that before claiming anything.
4 · Who was selected, and how
Volunteers? Worst performers? The readiest sites? Who was measured at the end, and who dropped out on the way?
5 · What else happened
List every other change to the same measure in the same period: a system, a price, a reorganization, a market. Name them before somebody else does.
6 · The design you already have
Was the rollout phased, and is the order recorded? Was anything allocated by a threshold? If a rollout is still ahead of you, write the order down now.
Tulser · White Papers · Performance Consulting
Where this paper sits
Two problems, one method, sixteen papers
| Business problem | Training request | |
|---|---|---|
| Owned by | The manager or director who owns the result. | L&D and the HR business partner. |
| What it prevents | Spending on the wrong intervention: a system, a reorganization, a hire. | Spending on a program that cannot reach the cause. |
| What it returns | The fix that moves the number, chosen on evidence. | The budget and the working hours that were not spent. |
| Method used | The same three analyses and five questions, which is why one capability serves both, and why the diagnosis no longer has to be bought in case by case. | |
One method, two returns, and a standing capability instead of a standing
consultancy line.
Two models carry the method. Gilbert’s six conditions ask what kind of cause; Rummler and Brache’s three levels ask where it sits. Both are sound and this series uses both, and it leads with Gilbert, because his unit is the accomplishment, which is what an organization already counts, and because his six conditions are the categories an organization can actually change.
Tulser · White Papers · Performance Consulting
Where this paper sits · continued
Where the method comes from
Two further pieces close the set and carry no number, because each points at all the numbered papers. Before the guide sits Arets L&D Business Models, the destination piece for the people who receive the requests: four models a learning function can run, and the route from HR-driven to business-driven. Last sits Solutions that cannot work, the field guide, ordered by the sentence that lands on your desk: seventeen forms a performance problem arrives in, each with an address in one of the numbered papers. Three orders in all: the destination you choose, the question you are on, and the form that landed on your desk.
How this series came about
Human performance technology travels the way a craft does: from hand to hand. Vivian Heijnen and Jos Arets learned the analysis from Dennis Mankin, in San Diego, more than twenty years ago, and have kept in contact with him ever since. Both remain grateful to him: for the rigor of the method as he taught it, and for the leadership he has given performance consulting over a long career.
What followed was twenty years of use. Vivian took the method into organizations in the Netherlands and well beyond them, and what accumulates over that many analyses is largely tacit: the cut nobody thought to make, the question that opens a defensive room, the finding that turns out to be an artifact of the data. Making that knowledge explicit, case by case, is what this series is for. Jos wrote it down as it went, in two books and more than forty articles and blog posts, most of them in Dutch, and one seven-part English series, Is AI the bicycle of the mind?, which number 15 grows out of. The books: Liever (g)een training with Boudewijn Overduin, Kostbaar misverstand with Vivian Heijnen, which this series takes a good deal of its thinking from.
None of that is reprinted here. It has been reworked: brought up to date, tested against the research that has appeared since, and dropped where the evidence no longer carries it. Theory that has never met a client is a position; practice that cannot account for itself is a story. This series is what remains when each is held to the other. Performance Consultant AI carries the same discipline to the desk where the decision is actually made.
About the cases. Every worked case in this series comes from our own practice. Names are changed and details altered so that no organization is recognizable, and the arithmetic reconciles. That is said once, here, rather than under each case: client work is confidential, and a case that named anybody would be a breach rather than a proof.
Tulser · White Papers · Performance Consulting
The series
Sixteen papers, six parts
Number 01 is the map and number 02 is the foundation. From number 05 on, every number is depth on exactly one step of the method. The filled block is the paper you are holding; the two unnumbered pieces close the set.
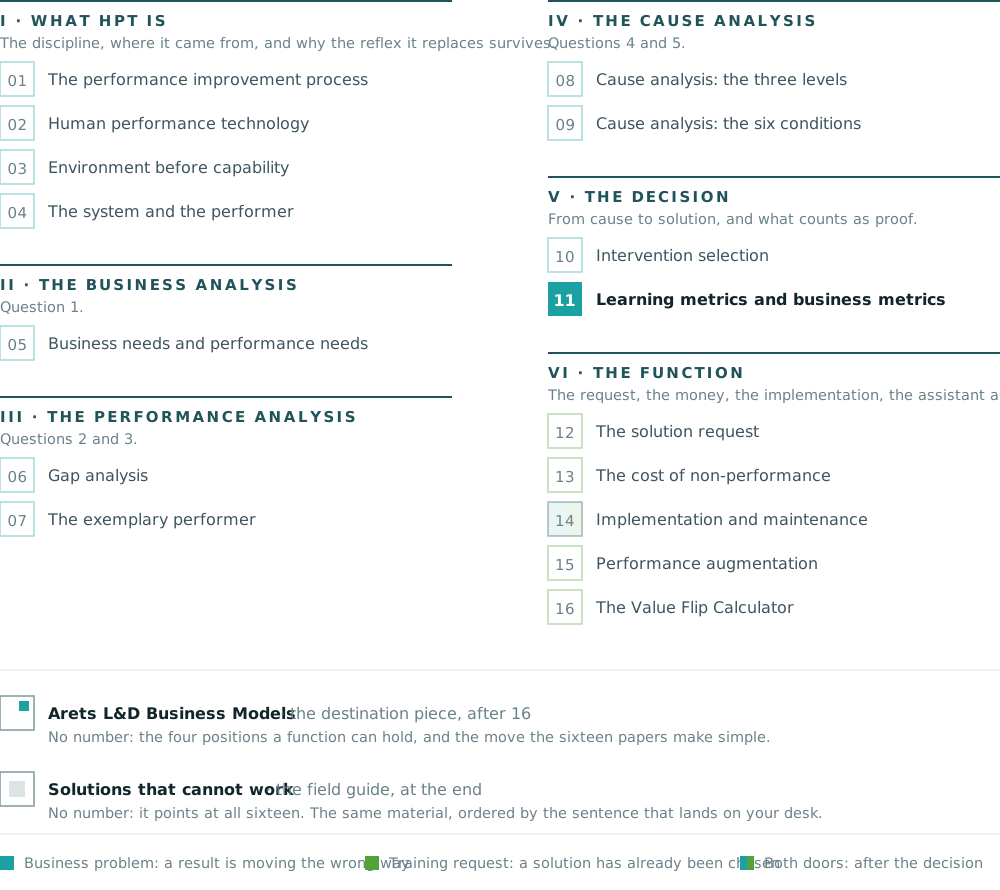
Tulser · White Papers · Performance Consulting
References
Where every claim in this paper comes from
Alliger, G. M., Tannenbaum, S. I., Bennett, W., Jr., Traver, H., & Shotland, A. (1997). A meta-analysis of the relations among training criteria. Personnel Psychology, 50(2), 341–358. https://doi.org/10.1111/j.1744-6570.1997.tb00911.x
Alliger, G. M., & Janak, E. A. (1989). Kirkpatrick’s levels of training criteria: Thirty years later. Personnel Psychology, 42(2), 331–342. https://doi.org/10.1111/j.1744-6570.1989.tb00661.x
Brinkerhoff, R. O. (2003). The success case method: Find out quickly what’s working and what’s not. Berrett-Koehler.
Diez Roux, A. V. (1998). Bringing context back into epidemiology: Variables and fallacies in multilevel analysis. American Journal of Public Health, 88(2), 216–222. https://doi.org/10.2105/AJPH.88.2.216
Garavan, T. N., McCarthy, A., Lai, Y., Clarke, N., Carbery, R., Gubbins, C., Sheehan, M., & Saunders, M. N. K. (2021). Putting the system back into training and firm performance research: A review and research agenda. Human Resource Management Journal, 31(4), 870–903. https://doi.org/10.1111/1748-8583.12337
Hamblin, A. C. (1974). Evaluation and control of training. McGraw-Hill.
Holton, E. F., III. (1996). The flawed four-level evaluation model. Human Resource Development Quarterly, 7(1), 5–21. https://doi.org/10.1002/hrdq.3920070103 [a published critique, not a meta-analysis; cited as the objection it is]
Kaufman, R., & Keller, J. M. (1994). Levels of evaluation: Beyond Kirkpatrick. Human Resource Development Quarterly, 5(4), 371–380. https://doi.org/10.1002/hrdq.3920050408
Kim, J., Chang, H., & Bell, B. S. (2025). Organizational-level training and performance: A meta-analytic investigation. Journal of Management. Advance online publication. https://doi.org/10.1177/01492063251327588
Kirkpatrick, D. L. (1959). Techniques for evaluating training programs. Journal of the American Society of Training Directors, 13(11), 3–9. First of four parts, 1959–1960.
Kirkpatrick, J. D., & Kirkpatrick, W. K. (2016). Kirkpatrick’s four levels of training evaluation. ATD Press.
Kirkpatrick Partners. (2026). The Kirkpatrick model. Retrieved 28 July 2026, from kirkpatrickpartners.com [the custodians’ own current statement of the model, cited for what they now teach]
Klein, K. J., Dansereau, F., & Hall, R. J. (1994). Levels issues in theory development, data collection, and analysis. Academy of Management Review, 19(2), 195–229. https://doi.org/10.2307/258703
Tulser · White Papers · Performance Consulting
References
Sources, continued
Kozlowski, S. W. J., Brown, K. G., Weissbein, D. A., Cannon-Bowers, J. A., & Salas, E. (2000). A multilevel approach to training effectiveness: Enhancing horizontal and vertical transfer. In K. J. Klein & S. W. J. Kozlowski (Eds.), Multilevel theory, research, and methods in organizations: Foundations, extensions, and new directions (pp. 157–210). Jossey-Bass.
Kozlowski, S. W. J., Chao, G. T., Grand, J. A., Braun, M. T., & Kuljanin, G. (2013). Advancing multilevel research design: Capturing the dynamics of emergence. Organizational Research Methods, 16(4), 581–615. https://doi.org/10.1177/1094428113493119
Kozlowski, S. W. J., & Klein, K. J. (2000). A multilevel approach to theory and research in organizations: Contextual, temporal, and emergent processes. In K. J. Klein & S. W. J. Kozlowski (Eds.), Multilevel theory, research, and methods in organizations: Foundations, extensions, and new directions (pp. 3–90). Jossey-Bass.
Kraiger, K., Ford, J. K., & Salas, E. (1993). Application of cognitive, skill-based, and affective theories of learning outcomes to new methods of training evaluation. Journal of Applied Psychology, 78(2), 311–328. https://doi.org/10.1037/0021-9010.78.2.311
Phillips, J. J. (1997). Return on investment in training and performance improvement programs. Gulf Publishing.
Ployhart, R. E., & Moliterno, T. P. (2011). Emergence of the human capital resource: A multilevel model. Academy of Management Review, 36(1), 127–150. https://doi.org/10.5465/amr.2009.0318
Robinson, W. S. (1950). Ecological correlations and the behavior of individuals. American Sociological Review, 15(3), 351–357. https://doi.org/10.2307/2087176
Rousseau, D. M. (1985). Issues of level in organizational research: Multi-level and cross-level perspectives. Research in Organizational Behavior, 7, 1–37.
Sitzmann, T., & Weinhardt, J. M. (2019). Approaching evaluation from a multilevel perspective: A comprehensive analysis of the indicators of training effectiveness. Human Resource Management Review, 29(2), 253–269. https://doi.org/10.1016/j.hrmr.2017.04.001
Thalheimer, W. (2018, January 30). Donald Kirkpatrick was NOT the originator of the four-level model of learning evaluation. Work-Learning Research. https://www.worklearning.com/2018/01/30/donald-kirkpatrick-was-not-the-originator-of-the-four-level-model-of-learning-evaluation/
Thalheimer, W. (2024). The Learning-Transfer Evaluation Model: Sending messages and nudging evidence-informed thinking to enable learning effectiveness (Version 13). Work-Learning Research. https://www.worklearning.com/ltem/ [a practitioner framework, not a validated model]
Thalheimer, W. (2025). Ten reasons NOT to measure impact: Prioritizing learning effectiveness over performative vanity metrics. https://www.worklearning.com/wp-content/uploads/2025/11/Ten-Reasons-NOT-to-Measure-Impact.pdf [a published argument, not a meta-analysis; cited as the objection it is]
Warr, P., Bird, M., & Rackham, N. (1970). Evaluation of management training: A practical framework, with cases, for evaluating training needs and results. Gower Press.
The three books named earlier in this paper are listed in full in number 02, so that they do not recur in every reference list.
Tulser · White Papers · Performance Consulting