


White Papers · Performance Consulting
Training request · the value
A training is requested. The diagnosis finds the cause; the calculator shows what that decision is worth.
The Value Flip Calculator
How L&D shows its value before the training starts. The Value Flip Calculator (VFC) prices the decision a diagnosis makes possible: what it does, in which order it is used, what it is good for, and where its limits lie.
No. 16 · © 2026 Tulser
In this paper
First the cause, then the price. The value of L&D, shown before the training starts.
The question
A training request is on your desk. How does L&D show business value before the training starts, in numbers a CFO accepts, instead of trying to prove it afterwards?
For
L&D and academy leaders, L&D advisers, learning designers and HR business partners, and the managers and CFOs they work with.
Read
20 minutes · five real cases, four case templates and a one-page worksheet.
| 01 | Why proving impact afterwards so often fails | Three reasons, the level error among them. |
| 02 | Diagnosis first, then the calculator | The order, and the method behind it. |
| 03 | The calculator | As it appears on the website. |
| 04 | The value L&D adds before the training | Five kinds, and why they count. |
| 05 | The CFO-proof report | Three numbers a CFO can check. |
| 06 | What it gives each business model | And everyone else at the table. |
| 07 | Why the cause decides | What the research shows, and what it does not. |
| 08 | Cases from practice | Real and anonymous. |
| 09 | Safeguards and limitations | What it does not claim. |
Tulser · White Papers · Performance Consulting
In one page
The paper in one page
L&D tries to prove its value after the training, at the one moment it can no longer change anything. The Value Flip Calculator moves that value to the decision.
- The problem. Proving impact afterwards rarely works. Studies seldom isolate the effect of training, the effect thins out on the way to the organization, and results measured in individuals do not simply add up to results of the organization (Garavan et al., 2019; Kim et al., 2025; Kozlowski et al., 2000).
- The order. First the diagnosis, then the calculator. The Performance Consultant AI applies Human Performance Technology and establishes whether knowledge is the cause. A price without a cause decides nothing.
- The value. Spend that does not go ahead, hours that stay in the work, a faster route to the result, protection for the training that does go ahead, and causes that keep coming back made visible.
- Why it counts. These numbers sit at the level where finance keeps them: the budget, the team dashboard, the roster. Nothing has to be isolated from everything else that moves a business.
- The limits. Avoided cost is not cash in the bank. Hours are not money. The calculator does not replace the evaluation of a training that goes ahead.
Placeholder · figures from Tulser’s case library
From Tulser’s practice
Between [year] and [year], Tulser diagnosed [number] training requests in [number] sectors. In [number] of them the main cause lay outside knowledge or skills; in [number] the diagnosis confirmed a skill gap and the training went ahead.
Tulser · White Papers · Performance Consulting
Show the value of L&D
before the training starts.
Tulser · White Papers · Performance Consulting
01 · Too late
Why proving impact afterwards so often fails
Attendance, satisfaction, test scores, sometimes a return on investment: L&D collects every one of these after the budget is spent. The effort to link them to business results fails for three reasons.
1 · The proof · Garavan et al., 2019
91%
of 217 studies measure training and performance at one moment; 61% take both from the same source. The effect of training is rarely isolated.
2 · The organization · Kim et al., 2025
ρ = .13
Across 159 studies, training relates to organizational performance, weakly and with wide variation by context.
2 · The effect thins out on the way
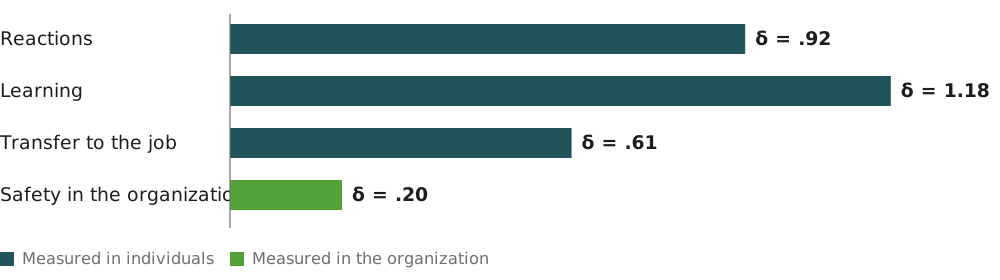
A meta-analysis of 157 studies of safety training shows the pattern in one set of numbers: large effects on what people learn, moderate effects on what they do at work, small effects on safety in the organization (Bisbey et al., 2026). None of this says training does not work. It says that its value at the level of the organization is smaller, less certain and hard to show afterwards.
Tulser · White Papers · Performance Consulting
01 · Too late, continued
3 · The level error, and what follows from it
The third reason sits deeper than measurement. It is a reasoning error about levels.
Most ways of showing impact follow one chain inside the individual, from reaction and learning to behavior and results, and then add the outcome up to the organization. Organizational results often arise from how people work together and from the conditions of the work, not from the sum of individuals (Kozlowski & Klein, 2000). An effect in individuals then says little about the organization, and its absence says little either (Kozlowski et al., 2000).
The error is easy to overstate. Where people work side by side on independent tasks, adding up comes closer to the truth, and measuring individuals remains worth doing; the error lies in the inference, not in the measurement. No. 11 in this series sets out the level error in a figure, with the evaluation models it affects (Arets, 2026c).
A practical conclusion
Thalheimer (2025) concludes that measuring impact is costly, open to bias and noisy, and does not make learning better, so L&D should measure what it can improve. This paper agrees and moves one step earlier. Before anyone improves a training, someone has to establish that training is the answer, and the value of that decision can be shown at the level where finance keeps its numbers.
Tulser · White Papers · Performance Consulting
02 · The order
Diagnosis first, then the calculator
The calculator prices a decision. Only a diagnosis shows which decision is right. That fixes the order.
The rule
The calculator follows the diagnosis. Used before it, the next step is the diagnosis, straight away.
A price without a cause decides nothing. It shows what a training would cost, not whether it can work.
The order of work
RequestA training is asked for
DiagnosisIs knowledge the cause?
CalculatorWhat the decision is worth
ReportManager and finance decide
Three monthsDelivered and kept
The diagnosis uses Human Performance Technology (HPT). It analyzes the business need, the performance that falls short and the cause, and its main gain is that someone has investigated whether a lack of knowledge or skill is really the cause. HPT looks for causes above the individual. Gilbert (1978) placed three of his six conditions for performance in the environment: information, resources and incentives. Tulser’s version of the method is described in earlier work and in this series (Arets & Heijnen, 2008; Arets, 2026b).
The Performance Consultant AI applies HPT to every request, which most L&D teams cannot do by hand for the volume they receive. It names the cause, where it sits (the organization, the process or the work) and how certain it is, and it recommends training only when a gap in knowledge or skill is confirmed (Arets, 2023, 2026d). How an organization then designs the solution differs per organization. The calculator prices the decision; it does not choose the design.
Tulser · White Papers · Performance Consulting
03 · The calculator
The Value Flip Calculator, as on the website
One screen with two sides: what saying yes costs, and what the decision keeps in the business.
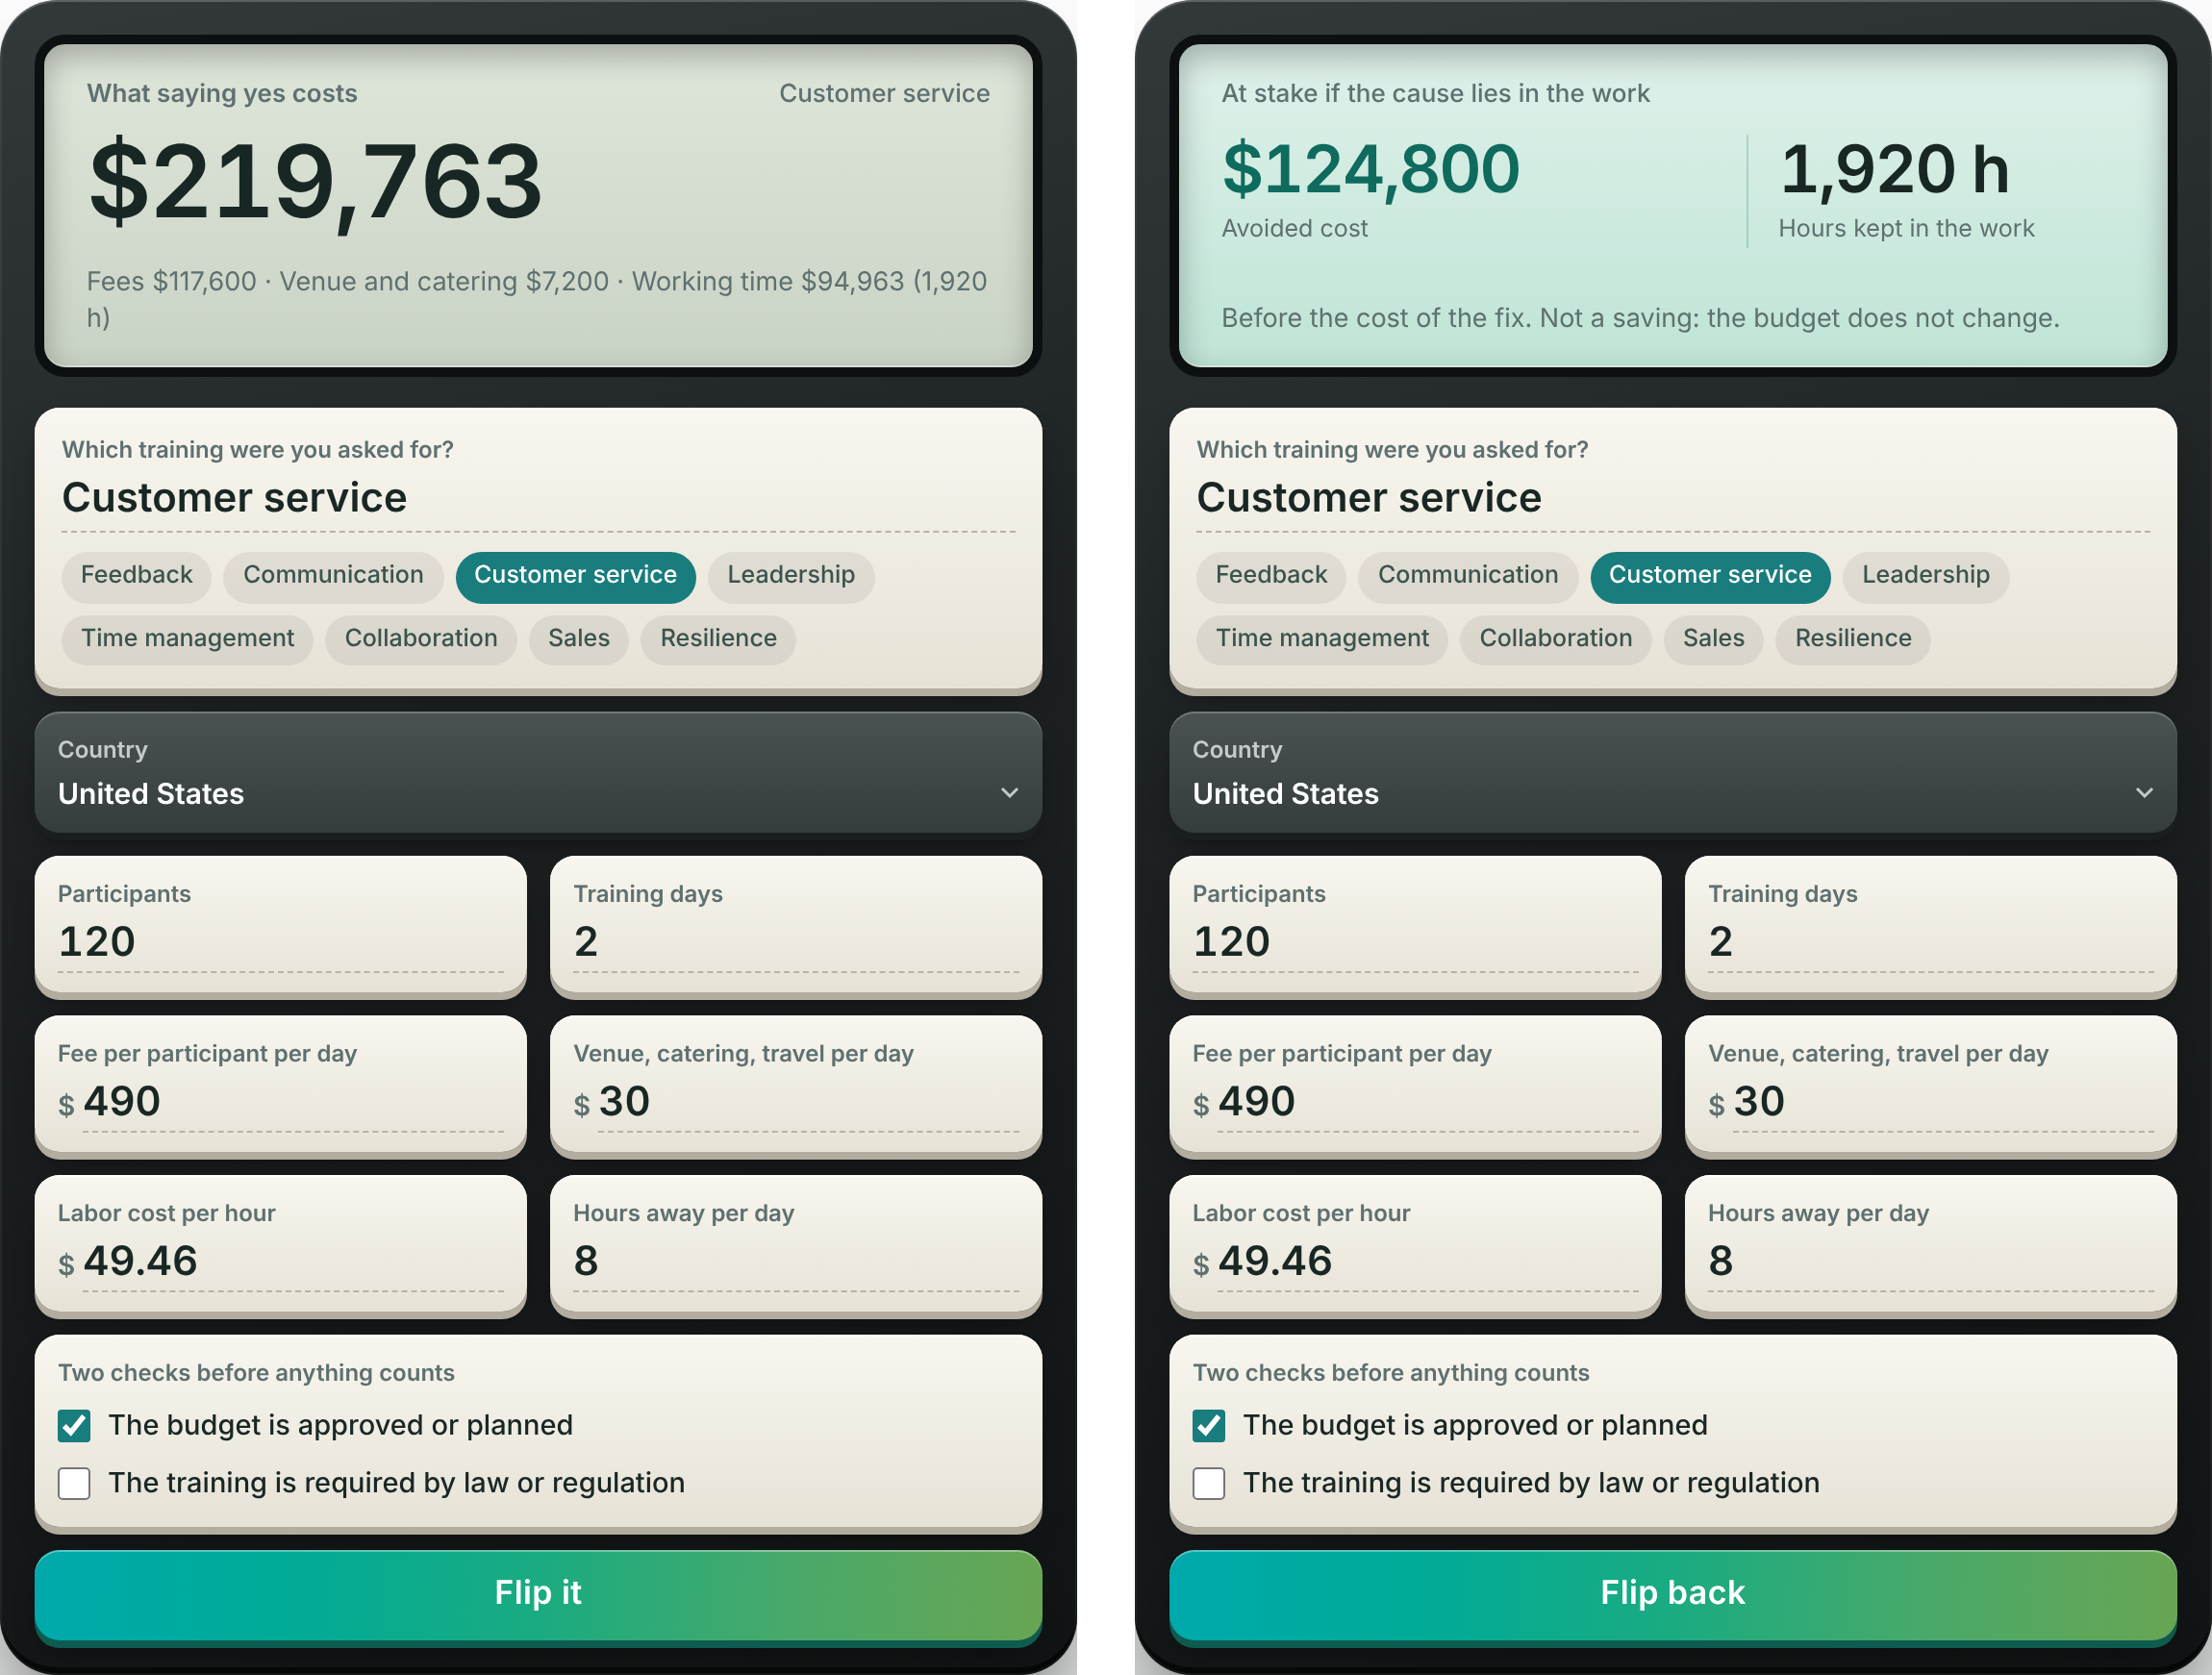
The left side adds up three lines: fees, venue and catering, and the working time of the participants. The right side shows what does not go ahead when the cause lies in the work: the cash, before the cost of the fix, and the hours that stay in the work. Two checks come first. Without an approved or planned budget, or when the law requires the training, nothing counts. Starting values come from national labor statistics (Eurostat, 2026; U.S. Bureau of Labor Statistics, 2026) and give way to the prices finance uses; each report carries its method version, VFC 1.0. The rest is on the website.
Tulser · White Papers · Performance Consulting
04 · The value
The value L&D adds before the training starts
L&D creates value every week that it hardly ever reports: the value of a better decision. The calculator makes five kinds of it visible.
| Value | What it is | Where finance sees it | When |
|---|---|---|---|
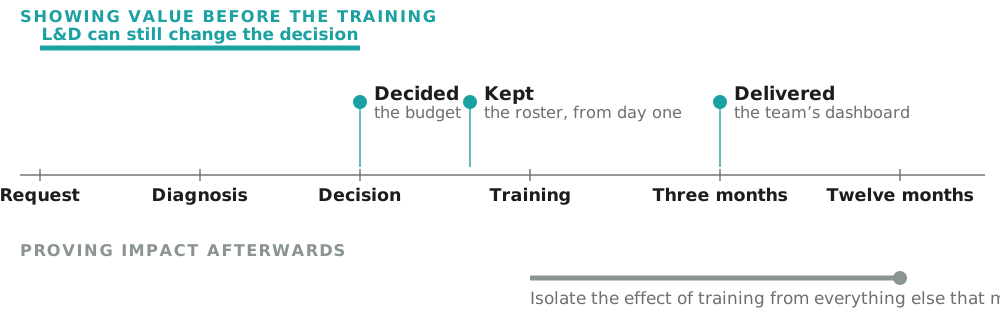
| 1 · The decision | Spend from an approved budget that does not go ahead, net of the cost of the fix | Budget or purchase order | At the decision |
| 2 · Time | Working hours that stay in the work; money only where they replace overtime, temporary staff or a vacancy | The roster | From day one |
| 3 · Speed | A fix that reaches the cause starts now, not after a training cycle, so the number the team tracks can move sooner | The team’s dashboard | After three months |
| 4 · Protection | The training that goes ahead starts with a confirmed gap, the blockers cleared and a baseline in place | The academy’s own results | After the training |
| 5 · Organizational learning | Causes that keep coming back across requests and departments become visible to the management team | The management report | Every quarter |
Value without revenue
In care, education and public services there is often no revenue to point to, and sometimes no agreed number at all. There the hours weigh most: a nurse who stays on the ward, a teacher who stays in class, temporary staff who are not hired. Incidents, waiting times and absence serve as the number to watch. Social return on investment offers the logic to correct such outcomes for what would have happened anyway (Nicholls et al., 2012).
Not instead of evaluation
When the diagnosis confirms a gap in knowledge or skill, the training goes ahead and deserves a proper evaluation: whether people can now make the decisions and do the tasks, and whether the number the team tracks moves. No. 11 in this series shows how (Arets, 2026c). The calculator adds the decision before it.
Tulser · White Papers · Performance Consulting
04 · The value, continued
At least as valuable as proving impact afterwards
The two answer different questions. Side by side, the difference is plain.
| Proving impact afterwards | Showing value before the training | |
|---|---|---|
| The question | Did the training change the business? | Is this the right decision, and what is it worth? |
| The moment | After the money is spent | While the decision is still open |
| The level | Claims an organizational result from individual learning | Stays where the numbers live: budget, team dashboard, roster |
| What must be isolated | The share of training among everything else that moved | Nothing for the first number; a baseline for the second |
| Who checks it | L&D, judging its own program | Finance, in its own records |
| What L&D can still change | Nothing | The decision |
| The honest limit | Hard to isolate; small average effect on the organization | Avoided cost is not cash; the second number needs an agreement |
The argument is a comparison, not a finding. Impact afterwards remains worth measuring where a stakeholder asks for it and the budget allows a sound design; even its sharpest critic says so (Thalheimer, 2025). But the value of a decision has three advantages a CFO recognizes. It is known when it matters. It needs no isolation from the rest of the business. And it is checked by finance rather than claimed by L&D.
Tulser · White Papers · Performance Consulting
05 · The report
The CFO-proof report: three numbers a CFO counts
L&D rarely goes to the CFO alone. The report is one page the manager, the budget holder and finance can all check.
The report carries the first three values of chapter 04 as three numbers: Decided at the decision, checked in the budget; Delivered after three months, checked in the team’s dashboard and priced with finance’s own unit cost; and Kept from day one, checked in the roster.
What the report shows per outcome of the diagnosis
| Diagnosis | Decided | Decision requested |
|---|---|---|
| Not run yet | At stake, not yet a value | Run the diagnosis now; hold the spend until the cause is known |
| Skill gap | None: the training goes ahead | Approve the training; results reported at three months |
| In the work | Avoided cost, net of the fix | Approve the fix instead of the training |
| Gap and blocker | None yet | Remove the blocker, then train |
| Recurring | Avoided cost, net of the fix | Take it to the management team |
The report claims only what it can show: completions alone support “trained”, not “competent”. Who signs it, each organization decides for itself.
Tulser · White Papers · Performance Consulting
Not less training.
Better learning.
Tulser · White Papers · Performance Consulting
06 · Business models
What the calculator gives each business model
Learning functions run one of four business models, from taking orders to creating value with the business, set out in the destination piece of this series (Arets, 2026a). The calculator, used after the diagnosis, gives each of them something different.
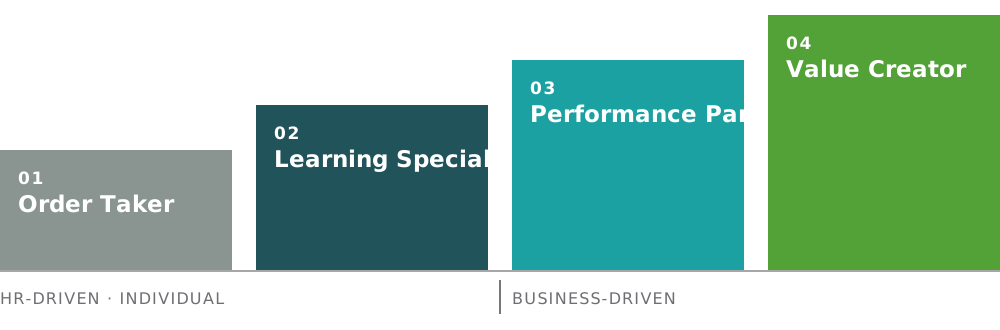
Order TakerThe first question before the yes, and the full price of the request on the table. Value no longer depends on chance.
Learning SpecialistProtection for the training that goes ahead: a confirmed gap, blockers cleared, a baseline and a result the academy can show.
Performance PartnerThe decision in finance’s language, prepared with the manager: decided, delivered and kept.
Value CreatorRequests made comparable across the organization, causes that keep coming back made visible, and a record of value over time.
Each model is set out in the destination piece of this series. The Learning Specialist is a full business model in its own right: where the task of L&D is a reliable supply of capable people, it is a legitimate end point. For learning specialists, a diagnosis before the design is part of good practice. In leadership training, programs built on a needs analysis showed larger effects on learning and transfer, though not on results (Lacerenza et al., 2017).
Tulser · White Papers · Performance Consulting
06 · Business models, continued
Everyone else at the table
| Who | What the calculator gives them |
|---|---|
| Manager | The full cost of the request, including the working time of the team, and a faster route to a fix that works. |
| CFO and controller | Numbers in finance’s own language, checkable in the budget, the dashboard and the roster. |
| Management team | Causes that keep coming back, visible across requests and departments. |
Medicine took this step first. In 2012, the Choosing Wisely campaign asked medical societies to name tests and treatments that add little for patients (Cassel & Guest, 2012), and researchers called the practice evidence-based de-implementation: stopping practices that are contradicted or unproven (Prasad & Ioannidis, 2014). A doctor who stops a treatment still treats the patient. L&D does the same: it does not say no to the manager. It says no to what will not work.
A maturing profession also names
what has been shown not to work.
Tulser · White Papers · Performance Consulting
07 · The cause
Why the cause decides
The calculator only creates value if the cause is right. The research below shows why the work around the learners matters, and how far that evidence reaches.
| What the research shows | Source |
|---|---|
| Leaving out studies that ask the same people about environment and transfer, the work environment relates to transfer at ρ = .23 (.36 with them). The link is stronger for open skills such as leadership and customer contact (.26) than for closed skills such as software (.04), though the closed-skill estimate rests on four studies. Support from the manager appears to weigh more (.31) than support from peers (.14); the authors flag both as based on small samples. | Blume et al., 2010 |
| Ability, knowledge and skill predict what people can do right after a training. Motivation and support at work predict what they do on the job. Several of these estimates rest on few studies. | Huang et al., 2015 |
| Transfer is not one moment but a cycle: people try what they learned, take in the feedback from the work and decide whether to try again. The authors propose this as a model to be tested, not as a finding. | Blume et al., 2019 |
| Across 73 studies, learning climate, autonomy and supportive leadership help learning at work; workload and time pressure mostly hinder it, with mixed findings. A narrative review, without effect sizes. | Wijga et al., 2025 |
For learning designers. Strong design models, such as four-component instructional design, build learning around whole tasks from real work. Across 12 studies, all in schools and higher education, that improves learning (d = 0.79), with large differences between studies (Costa et al., 2022). Its authors add that transfer involves more than good instructional design, because the work environment can range from favorable to obstructing (Frerejean et al., 2023). A diagnosis before the design does not replace the designer. It protects the design.
Tulser · White Papers · Performance Consulting
07 · The cause, continued
What the evidence does not show
A paper that asks L&D to drop claims without evidence has to hold itself to the same standard.
Two popular numbers do not help. The claim that only 10% of training transfers to the job goes back to a rhetorical question in a 1982 article, not to measurement (Ford et al., 2011). The claim that 80% or more of performance problems lie in the environment is an estimate from experience and from surveys of what employees believe. The calculator uses neither. It does not need a percentage: nobody knows per request where the cause lies, and that is exactly why the diagnosis comes first.
Where the research stops
Most of the evidence on the work environment is correlational, and studies that ask the same people about environment and transfer inflate the link (Blume et al., 2010). Several moderator estimates rest on a handful of studies. The 4C/ID evidence comes from education, not from workplaces. And the effect of training on organizational results is small on average and varies with context (Kim et al., 2025). The honest numbers are the smaller ones. They are still large enough to make the cause worth finding before the money is spent.
How this paper uses the research
Effects are given with their size, their basis and the caveat their authors give. A number from one meta-analysis is an average across studies, not a promise for the request on your desk. That is the work of the diagnosis.
Tulser · White Papers · Performance Consulting
08 · Practice
Requests from practice
Tulser holds [dozens of] real, anonymous cases. Five of them, each with the main cause in the work:
| Organization | Requested | Done | Result |
|---|---|---|---|
| Government | Customer service training for every employee · €6.6 million | Bottlenecks in systems, procedures and decision rights removed · under €700,000 | 50% fewer complaints within twelve months |
| Retail | Sales training for 1,500 store employees · about €750,000 before lost working time | One button in the checkout system, no more checkout-time target · €40,000 | 25% more accessory sales · about €2.8 million margin a year |
| Youth care | Time management and resilience training for 350 social workers | Simpler administration, a link between three systems, peer review back on the schedule | Less short-term absence, more time for the children |
| IT service desk | Five-day technical training for 200 employees · €600,000 | Access restored for the ten most common tickets, an editor for the knowledge base | First-contact resolution from 55% to 82% · about €850,000 a year |
| Manufacturing | Quality training for 400 operators · €500,000 | New lighting at the inspection stations, stricter supplier standards · €15,000 | Rejected parts from 7% to 1.5% · about €1.2 million a year |
About these cases
All examples are real and anonymous; amounts are rounded. They were chosen because the cause lay in the work. In other requests the diagnosis confirms a skill gap and the training goes ahead; the next page shows one. The cases illustrate the flip; they do not establish how often the cause lies in the work.
Tulser · White Papers · Performance Consulting
08 · Cases
One case per outcome
One case for each outcome of the diagnosis, including one where training was the answer.
Placeholder · Tulser fills these four cases from its case library
Training was the answer
[Training requested] for [number] [roles]
Sector: [sector] · [size band]
Cause: [the confirmed gap in knowledge or skill]
Blocker cleared: [what in the work was fixed first]
[n/a]Decided
[KPI change]Delivered
[hours]Kept
Gap and a blocker in the work
[Training requested] for [number] [roles]
Sector: [sector] · [size band]
Cause: [the gap and the blocker found]
Decision: [blocker removed, then training]
[n/a]Decided
[KPI change]Delivered
[hours]Kept
Cause in the work · not-for-profit
[Training requested] for [number] [roles]
Sector: [care, education or public] · [size band]
Cause: [tool, process or target]
Decision: [the fix in the work]
[amount]Decided
[incidents, absence]Delivered
[hours]Kept
A cause that keeps coming back
[Recurring cause] across [number] requests
Sector: [sector] · [size band]
Cause: [the cause that kept coming back]
Decision: [what the management team decided]
[amount]Decided
[KPI change]Delivered
[hours]Kept
How Tulser keeps cases anonymous
Sector and a size band, never a name, place or logo. Amounts rounded, years without months. No detail that lets an insider recognize the organization. A quote only with written consent, attributed to a role.
Tulser · White Papers · Performance Consulting
First the cause.
Then the price.
Tulser · White Papers · Performance Consulting
09 · Safeguards
Built to stay on L&D’s side
A number that can be misread will be. Without rules, the flip turns into a budget cut, a case against training or a question about past waste. Six safeguards are built into the calculator and the report.
- Real budgets only. No approved or planned budget, no avoided cost.
- Required training stays. Training required by law or regulation is never flipped. The question becomes how to make it work in the job.
- Forward only. The calculator works on the request in front of you, never on last year’s decisions. Past decisions were made without a diagnosis; that is a gap in the process, not a failure of L&D.
- The controller’s prices. Every starting value shows its source and gives way to the prices finance sets. Each report carries its method version.
- The money stays in performance. Agree with the CFO in advance that avoided cost stays twelve months in a budget for fixes and for training that works.
- Shared credit. The decision belongs to the manager; L&D prepared it. The report says so.
For academies and learning specialists
The diagnosis does not compete with the training an academy offers. It protects it. A training that starts with a confirmed gap, the blockers cleared and a baseline in place has a better chance of landing, and a result the academy can show.
Tulser · White Papers · Performance Consulting
09 · Limitations
What the calculator does not claim
The calculator is credible only if its limits are on the same page as its numbers.
- It does not diagnose. Used before the diagnosis, it shows only what is at stake, and the diagnosis has to follow at once.
- Starting values are averages. Labor costs come from national statistics; in countries that publish earnings only, the real cost is higher. Fees and venue costs are Tulser’s starting values and vary widely in practice.
- Avoided cost is not cash in the bank. It becomes money for something else only when the budget is released or redirected.
- Hours are not money. Only where they replace overtime, temporary staff or a vacancy.
- The cost of the fix and of the diagnosis count. The report subtracts the fix; the time spent on the diagnosis is not in the calculator and belongs in the conversation.
- The second number needs an agreement. Without a baseline and a price agreed in advance, the delivered value is an opinion.
- It does not prove what a training earns. It shows the value of a better decision, not the effect of a training on results, which remains hard to isolate (Garavan et al., 2019). A training that goes ahead still needs its own evaluation.
- Not all value is in the three numbers. Safety, quality and risk often weigh more than cost, and the calculator does not price them.
- The evidence has limits too. Much of the research on the work environment shows what goes together, not always what causes what, and several estimates rest on few studies.
- The cases illustrate. They come from Tulser’s practice and do not establish a rate.
Tulser · White Papers · Performance Consulting
Run it yourself
Run it on your next request
Five questions, in this order, before anyone says yes.
1 · The request, as it was asked
Who asked, for whom, and what problem they named.
2 · What should be different in three months?
The number the team already tracks, and its value today.
3 · Is knowledge the cause?
The diagnosis. If not: information, resources or incentives, and where: the organization, the process or the work?
4 · The cost of yes, and the two checks
Fees · venue and catering · working time. Is the budget approved? Is the training required?
5 · The decision, and its owners
The manager decides; L&D prepares.
Started with question 4? Then question 3 is next, the same week. The Value Flip Calculator and the free diagnosis are at tulser.com/en/value-flip.
Tulser · White Papers · Performance Consulting
Where this paper sits
Two problems, one method, sixteen papers
| Business problem | Training request | |
|---|---|---|
| Owned by | The manager or director who owns the result. | L&D and the HR business partner. |
| What it prevents | Spending on the wrong intervention: a system, a reorganization, a hire. | Spending on a program that cannot reach the cause. |
| What it returns | The fix that moves the number, chosen on evidence. | The budget and the working hours that were not spent. |
| Method used | The same three analyses and five questions, which is why one capability serves both, and why the diagnosis no longer has to be bought in case by case. | |
One method, two returns, and a standing capability instead of a standing
consultancy line.
Two models carry the method. Gilbert’s six conditions ask what kind of cause; Rummler and Brache’s three levels ask where it sits. Both are sound and this series uses both, and it leads with Gilbert, because his unit is the accomplishment, which is what an organization already counts, and because his six conditions are the categories an organization can actually change.
Tulser · White Papers · Performance Consulting
Where this paper sits · continued
Where the method comes from
Two further pieces close the set and carry no number, because each points at all the numbered papers. Before the guide sits Arets L&D Business Models, the destination piece for the people who receive the requests: four models a learning function can run, and the route from HR-driven to business-driven. Last sits Solutions that cannot work, the field guide, ordered by the sentence that lands on your desk: seventeen forms a performance problem arrives in, each with an address in one of the numbered papers. Three orders in all: the destination you choose, the question you are on, and the form that landed on your desk.
How this series came about
Human performance technology travels the way a craft does: from hand to hand. Vivian Heijnen and Jos Arets learned the analysis from Dennis Mankin, in San Diego, more than twenty years ago, and have kept in contact with him ever since. Both remain grateful to him: for the rigor of the method as he taught it, and for the leadership he has given performance consulting over a long career.
What followed was twenty years of use. Vivian took the method into organizations in the Netherlands and well beyond them, and what accumulates over that many analyses is largely tacit: the cut nobody thought to make, the question that opens a defensive room, the finding that turns out to be an artifact of the data. Making that knowledge explicit, case by case, is what this series is for. Jos wrote it down as it went, in two books and more than forty articles and blog posts, most of them in Dutch, and one seven-part English series, Is AI the bicycle of the mind?, which number 15 grows out of. The books: Liever (g)een training with Boudewijn Overduin, Kostbaar misverstand with Vivian Heijnen, which this series takes a good deal of its thinking from.
None of that is reprinted here. It has been reworked: brought up to date, tested against the research that has appeared since, and dropped where the evidence no longer carries it. Theory that has never met a client is a position; practice that cannot account for itself is a story. This series is what remains when each is held to the other. Performance Consultant AI carries the same discipline to the desk where the decision is actually made.
About the cases. Every worked case in this series comes from our own practice. Names are changed and details altered so that no organization is recognizable, and the arithmetic reconciles. That is said once, here, rather than under each case: client work is confidential, and a case that named anybody would be a breach rather than a proof.
Tulser · White Papers · Performance Consulting
The series
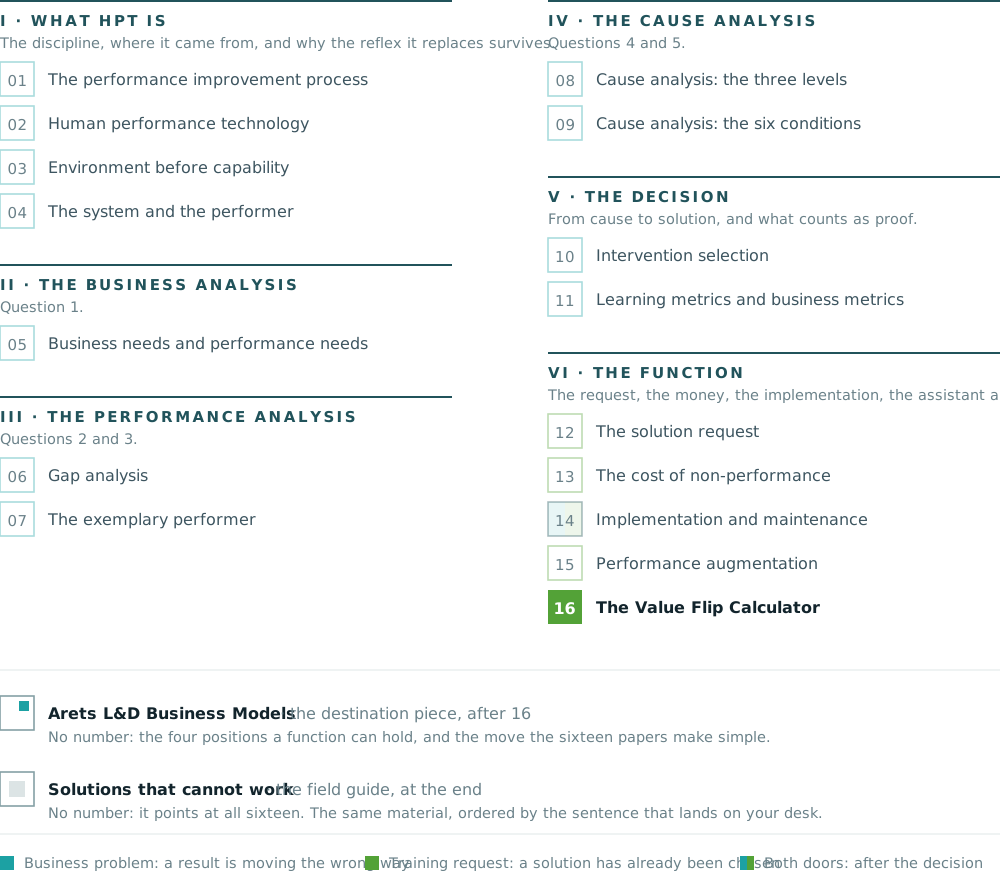
Sixteen papers, six parts
Number 01 is the map and number 02 is the foundation. From number 05 on, every number is depth on exactly one step of the method. The filled block is the paper you are holding; the two unnumbered pieces close the set.
Tulser · White Papers · Performance Consulting
References
Where every claim in this paper comes from
Arets, J. (2023, July 26). Is AI the bicycle of the mind? Augmenting human capabilities with AI. eLearning Industry. https://elearningindustry.com
Arets, J. (2026a). Arets L&D Business Models: A future-proof framework for corporate L&D [White paper]. Tulser.
Arets, J. (2026b). Human performance technology (White Papers · Performance Consulting, No. 02). Tulser.
Arets, J. (2026c). Learning metrics and business metrics (White Papers · Performance Consulting, No. 11). Tulser.
Arets, J. (2026d). Performance augmentation (White Papers · Performance Consulting, No. 15). Tulser.
Arets, J., & Heijnen, V. (2008). Kostbaar misverstand: Van training naar business improvement [A costly misunderstanding: From training to business improvement]. Academic Service.
Bisbey, T. M., Linhardt, R. M., Woods Herron, A., Kilcullen, M. P., & Salas, E. (2026). How does training contribute to workplace safety? A meta-analysis examining the effects of safety training. Journal of Applied Psychology, 111(2), 175–194. https://doi.org/10.1037/apl0001309
Blume, B. D., Ford, J. K., Baldwin, T. T., & Huang, J. L. (2010). Transfer of training: A meta-analytic review. Journal of Management, 36(4), 1065–1105. https://doi.org/10.1177/0149206309352880
Blume, B. D., Ford, J. K., Surface, E. A., & Olenick, J. (2019). A dynamic model of training transfer. Human Resource Management Review, 29(2), 270–283. https://doi.org/10.1016/j.hrmr.2017.11.004
Cassel, C. K., & Guest, J. A. (2012). Choosing Wisely: Helping physicians and patients make smart decisions about their care. JAMA, 307(17), 1801–1802. https://doi.org/10.1001/jama.2012.476
Costa, J. M., Miranda, G. L., & Melo, M. (2022). Four-component instructional design (4C/ID) model: A meta-analysis on use and effect. Learning Environments Research, 25(2), 445–463. https://doi.org/10.1007/s10984-021-09373-y
Eurostat. (2026). Hourly labour costs (lc_lci_lev) [Data set]. https://ec.europa.eu/eurostat/databrowser/view/lc_lci_lev/default/table
Ford, J. K., Yelon, S. L., & Billington, A. Q. (2011). How much is transferred from training to the job? The 10% delusion as a catalyst for thinking about transfer. Performance Improvement Quarterly, 24(2), 7–24. https://doi.org/10.1002/piq.20108
Frerejean, J., van Merriënboer, J. J. G., Condron, C., Strauch, U., & Eppich, W. (2023). Critical design choices in healthcare simulation education: A 4C/ID perspective on design that leads to transfer. Advances in Simulation, 8, Article 5. https://doi.org/10.1186/s41077-023-00242-7
Tulser · White Papers · Performance Consulting
References
Sources, continued
Garavan, T. N., McCarthy, A. M., Sheehan, M., Lai, Y., Saunders, M. N. K., Clarke, N., Carbery, R., & Shanahan, V. (2019). Measuring the organizational impact of training: The need for greater methodological rigor. Human Resource Development Quarterly, 30(3), 291–309. https://doi.org/10.1002/hrdq.21345
Gilbert, T. F. (1978). Human competence: Engineering worthy performance. McGraw-Hill.
Huang, J. L., Blume, B. D., Ford, J. K., & Baldwin, T. T. (2015). A tale of two transfers: Disentangling maximum and typical transfer and their respective predictors. Journal of Business and Psychology, 30(4), 709–732. https://doi.org/10.1007/s10869-014-9394-1
Kim, J., Chang, H., & Bell, B. S. (2025). Organizational-level training and performance: A meta-analytic investigation. Journal of Management. Advance online publication. https://doi.org/10.1177/01492063251327588
Kozlowski, S. W. J., Brown, K. G., Weissbein, D. A., Cannon-Bowers, J. A., & Salas, E. (2000). A multilevel approach to training effectiveness: Enhancing horizontal and vertical transfer. In K. J. Klein & S. W. J. Kozlowski (Eds.), Multilevel theory, research, and methods in organizations: Foundations, extensions, and new directions (pp. 157–210). Jossey-Bass.
Kozlowski, S. W. J., & Klein, K. J. (2000). A multilevel approach to theory and research in organizations: Contextual, temporal, and emergent processes. In K. J. Klein & S. W. J. Kozlowski (Eds.), Multilevel theory, research, and methods in organizations: Foundations, extensions, and new directions (pp. 3–90). Jossey-Bass.
Lacerenza, C. N., Reyes, D. L., Marlow, S. L., Joseph, D. L., & Salas, E. (2017). Leadership training design, delivery, and implementation: A meta-analysis. Journal of Applied Psychology, 102(12), 1686–1718. https://doi.org/10.1037/apl0000241
Nicholls, J., Lawlor, E., Neitzert, E., & Goodspeed, T. (2012). A guide to social return on investment (Rev. ed.). The SROI Network.
Prasad, V., & Ioannidis, J. P. A. (2014). Evidence-based de-implementation for contradicted, unproven, and aspiring healthcare practices. Implementation Science, 9, Article 1. https://doi.org/10.1186/1748-5908-9-1
Thalheimer, W. (2025). Ten reasons NOT to measure impact: Prioritizing learning effectiveness over performative vanity metrics. https://www.worklearning.com/wp-content/uploads/2025/11/Ten-Reasons-NOT-to-Measure-Impact.pdf
U.S. Bureau of Labor Statistics. (2026). Employer costs for employee compensation, June 2026 [News release]. https://www.bls.gov/news.release/ecec.nr0.htm
Wijga, M., Beausaert, S., & Kyndt, E. (2025). What drives workplace learning: A systematic review of key antecedents. Journal of Workplace Learning, 37(9), 90–113. https://doi.org/10.1108/JWL-05-2025-0119
Tulser · White Papers · Performance Consulting