


White Papers · Performance Consulting
Business problem · question 2
Everyone agrees performance is not good enough. Nobody has said how far off it is.
Gap analysis
Two values on one measure, where the second one is allowed to come from, and why the distribution of a gap tells you more about its cause than its size ever will.
No. 06 · © 2026 Tulser
In this paper
A gap needs two numbers. Most problems arrive with none.
The question
The measure exists and it is not where it should be. What is it now, what should it be, where is that second number allowed to come from, and is the shortfall spread across everybody or sitting in one corner?
For
Anyone who owns a result or is asked to fix one: line managers and directors, operations, quality and continuous improvement, finance, OD, HR business partners and L&D.
Read
22 minutes · with a worked case and a one-page instrument.
| 01 | Two numbers and a period | What a gap actually is, and how rarely one arrives complete. |
| 02 | The first number is harder than it looks | Four ways current performance is wrong before anybody has argued about it. |
| 03 | Where desired performance may come from | Four sources, ranked by how well each survives a skeptical room. |
| 04 | Four ways a desired level goes wrong | Perfection, the imported benchmark, the round number and the negotiated one. |
| 05 | The distribution of the gap | Uniform, concentrated, bimodal, and what each pattern tells you to examine next. |
| 06 | When there is no number at all | Four moves that replace a measure nobody keeps, and the three traps to avoid instead. |
| 07 | The distributor whose target came from a brochure | A worked case in which the gap turned out to be smaller and entirely elsewhere. |
| 08 | What this does not claim | Four limits, because the rest is not credible without them. |
| · | Run it yourself | Both numbers, and the cut you have not made. |
Tulser · White Papers · Performance Consulting
A target nobody can derive
is an opinion with a decimal point.
Tulser · White Papers · Performance Consulting
01 · What a gap is
Two numbers and a period
A gap is a subtraction. It needs a measure, a value the measure has now, a value it ought to have, and the stretch of time both were counted over. Four elements, and problems almost never arrive with more than one of them.
| What arrives | What is missing | What it is worth as evidence |
|---|---|---|
| “On-time delivery is a problem” | Everything | Nothing yet. It says somebody is unhappy, which is where every analysis starts. |
| “On-time delivery is 78 percent” | The desired value and the period. | Half a fact. 78 could be excellent or catastrophic and nothing here says which. |
| “On-time delivery should be 95 percent” | Where 95 came from. | An aspiration until somebody can derive it. Section 03 is about that derivation. |
| “78 against 95, over the last four quarters” | Nothing. This is a gap. | A fact two people can argue about on evidence rather than on conviction. |
Four statements about the same situation. Only the fourth can be acted on, and only
the fourth can be shown to be wrong.
Rummler put the point at the level of the whole organization long before anyone was arguing about dashboards: a result is a property of the system that produces it, so a number without the system around it is not yet information (Rummler & Brache, 2013). The same holds one level down. A measure with no desired value beside it cannot tell you whether the system is working.
The period matters more than it seems. A single month is noise; a single year hides everything that happened inside it. Four quarters is usually the shortest span that separates a trend from a bad week, and it has the additional merit of being the span the organization already reports on.
Why this question sits second
Number 05 established which result matters and who reports it. This one puts two values on it. Doing them in that order matters: a gap computed on the wrong measure is a precise answer to a question nobody asked, and it is far more persuasive than no answer at all, which is what makes it dangerous.
Tulser · White Papers · Performance Consulting
02 · The first number
Current performance is harder than it looks
The measure exists and somebody reports it, so the first number feels like a lookup. It is not. Four faults recur in it, and all four are found by asking one question: who computes this, and from what?
| The fault | What it looks like | What to do |
|---|---|---|
| Two definitions | Operations reports 84 percent and finance reports 79. Both are right; they count a partial delivery differently. | Reconcile the definitions before anything else. This is frequently where the analysis ends, because the disagreement was the problem. |
| The wrong grain | An annual figure that hides a quarter, a national figure that hides a site, a mean that hides a distribution. | Ask for the underlying records rather than the report. The grain you need is the grain the work happens at. |
| Survivorship | The measure counts what completed. Orders that were canceled, cases that were withdrawn and customers who left are not in it. | Ask what leaves the denominator, and why. The excluded population is often where the problem lives. |
| The measure is fed by the people it measures | Completion is recorded by the person completing it, so the number reflects reporting behavior as much as work. | Find one independent trace (a timestamp, a system log, a customer record) and compare. |
Four faults, one diagnostic question. None of them requires new measurement; all of
them require somebody to look behind the report.
The fourth deserves emphasis because it is the one that quietly invalidates the whole analysis. Any measure that people know they are judged on will be managed, and the management shows up in the number before it shows up in the work. That is not dishonesty; it is what measures do. The remedy is not suspicion but triangulation: one independent trace is enough to establish whether the reported number and the actual one have drifted apart.
Tulser · White Papers · Performance Consulting
“
Over and over we shall see that only when we have made a proper analysis of accomplishments and their measures will we have any sensible reason to concern ourselves with behavior.
Thomas F. Gilbert
Human Competence, 1978, p. 73
Tulser · White Papers · Performance Consulting
03 · The second number
Where desired performance may come from
This is the weakest joint in most business cases and almost nobody inspects it. The first number can be looked up. The second one has to be argued for, and there are only four places it can honestly come from.
| Source | What it is | How well it survives an argument |
|---|---|---|
| 1 · What somebody here already achieves | The level an exemplary performer reliably produces under the same conditions. | Strongest. It has been done, on this system, with these customers, by a colleague whose name is known. The objection that it cannot be done has already been answered. |
| 2 · What the business demonstrably needs | Derived from something downstream: a delivery promise, a capacity plan, a margin, a contractual threshold. | Strong, if the derivation is shown. Most of the time it is not shown, and the number is treated as self-evident because it appears in a contract. |
| 3 · A regulatory or physical floor | The level below which the organization is non-compliant or the equipment fails. | Firm but low. It is a floor, not a target. Using it as the desired level caps ambition at “not in breach”. |
| 4 · An external benchmark or an aspiration | What a competitor claims, what an industry report says, or what somebody decided sounded right. | Weakest. The benchmark was produced in a different environment with a different definition; the aspiration was produced in a meeting. |
Four sources in descending order of defensibility. Most organizations use the
fourth, which is why most business cases rest on an opinion at exactly the point that carries the
weight.
The first source is the gift this question receives from the next one. Number 07 establishes who already achieves the result and what they have that the others lack; the level they reliably reach is the desired level, and it arrives with its own proof attached. Where no such person exists, that absence is itself a finding: a level nobody has ever reached is a design problem rather than a benchmark, and it should be reported as one.
Tulser · White Papers · Performance Consulting
03 · continued
And a word about targets
There is a long-running argument in management about goals, whether stretching targets lift performance or distort it, and the desired level in an analysis sits close enough to it to be mistaken for one. It is worth separating them, because the two are not the same object.
Both sides of that argument have something. A specific, difficult target does concentrate effort, and organizations that over-prescribe targets reliably get narrowed attention, gaming and the occasional scandal (Ordóñez et al., 2009). Where the tipping point lies in ordinary work is not settled, and this paper does not need it to be, because the desired level in an analysis is doing a different job entirely.
What it is wise to take account of meanwhile
The desired level in an analysis is a measurement point, not a motivational device. Its job is to make the gap computable and to give the later evaluation something to be judged against. Set it to measure by. If the organization also intends to use it as a target (attached to a bonus, a review or a league table) that is a separate decision, with its own literature and its own failure modes, and it should be taken separately and by somebody else. Where the two do get combined, expect the number to acquire an interest of its own, and read the literature on gaming before you attach it to anybody’s bonus.
Keeping those apart has a practical consequence that is easy to miss. A measurement point can be set at what a colleague already achieves, because nobody is being asked to promise it. The moment the same number becomes a target, the person it applies to acquires an interest in arguing it down, and the conversation stops being about evidence. Analyses that conflate the two lose the argument they should have won.
Tulser · White Papers · Performance Consulting
04 · The failures
Four ways a desired level goes wrong
Each of these produces a number that looks authoritative and cannot be defended. Together they account for most of the desired levels we have met in practice. [practitioner observation, not a measured frequency]
| The failure | How it happens | What it costs |
|---|---|---|
| Perfection | Zero errors, one hundred percent, no complaints. Nobody believes it, so nobody plans against it. | The gap becomes uncomputable and the analysis loses its arithmetic. The corrective is the third question: measure the gap against what the exemplary performer already achieves, not against zero. |
| The imported benchmark | A figure from an industry report, produced elsewhere with a different definition and a different customer mix. | It cannot be defended when challenged, and it will be challenged by whoever has to deliver it. |
| The round number | 95 percent, because 94 sounds unfinished. The decimal was chosen for its appearance. | It is usually too high or too low by a margin larger than the gap the analysis is examining. |
| The negotiated number | Set in a meeting between somebody who wants it high and somebody who has to deliver it. | It encodes the balance of power in the room rather than anything about the work, and it moves when the room does. |
Four bad second numbers. The test that catches all four is one question: who can
derive this, and from what?
Gilbert’s answer to all four is the first source in the previous section, and it is worth stating as a rule rather than a preference: the standard is what the exemplary performer accomplishes, because that is the only level anybody can prove is reachable in this organization (Gilbert, 1978).
That question is worth asking out loud and in the meeting. Not as a challenge but as a request: walk me from something we already know to this figure. A desired level drawn from source one or two takes about thirty seconds to derive. One drawn from source four cannot be derived at all, and the silence that follows is the finding.
Tulser · White Papers · Performance Consulting
05 · The distribution
The distribution of the gap and what it tells you
Here is the part of this question that most analyses never reach. The size of a gap tells you what is at stake. The distribution of it (how the shortfall spreads across the people, sites or products that make up the number) tells you where to look for the cause.
Take a unit of twenty people doing one job. The desired level is 90 and the unit averages 78, so the gap is twelve points. That single sentence is what almost every analysis reports, and three completely different situations produce it. In the first, all twenty sit between 77 and 79: everyone is short, nobody much more than anyone else. In the second, fifteen are at 86 and five are at 54. In the third, ten are at 86 and ten are at 70. Each of the three averages 78. Each is a different problem with a different fix, and the average conceals which one you have.
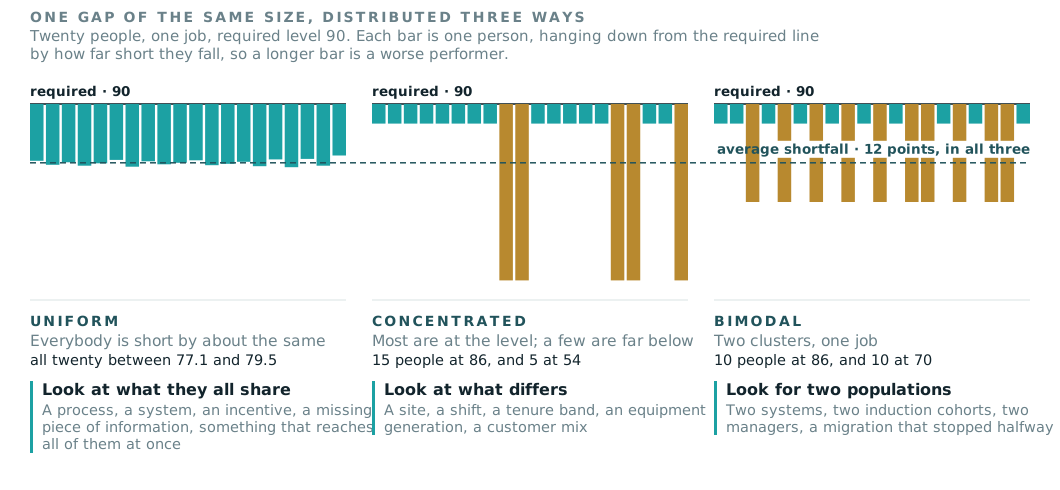
Each bar is one person, hanging down from the desired level by how far short
they fall, so a longer bar is a worse performer. The dashed line is the average shortfall, and it sits
at the same depth in all three panels. An analysis that stops at that line cannot tell the panels
apart.
The practical difference is large. If the shortfall is uniform, whatever is chosen has to reach all twenty people, and it is worth paying for something that does. If it is concentrated, fifteen of the twenty need nothing at all, three-quarters of the unit, and a program bought for the whole unit spends three-quarters of its budget on people who are already at the level. The average is the same in both. It cannot tell you which of the two you are about to buy.
Tulser · White Papers · Performance Consulting
05 · continued
Reading the distribution, and the trap inside it
The three patterns point at three different kinds of cause, and the reasoning behind each is short enough to state in a sentence. The twenty people from the previous page are still the example.
| Pattern | The reasoning | Where to look |
|---|---|---|
| Uniform all twenty between 77 and 79 | If everybody is short by about the same amount, the cause is something they all have in common. Individual differences would produce spread and there is none. | The process, the system, the information, the incentive: anything that reaches all of them at once: common causes, in Deming’s sense (Deming, 2000). |
| Concentrated fifteen at 86, five at 54 | If most are at the level and a few are far below, the cause is something that differs between those two groups rather than something they share. Note what this one means: fifteen of the twenty need nothing at all. | Site, shift, tenure, equipment generation, customer mix, manager. Establish which of those the low group has in common before assuming it is the people. |
| Bimodal ten at 86, ten at 70 | Two clusters doing one job means two versions of the job. Something has divided the population and nobody has noticed the division. | Two systems, two induction cohorts, a migration completed for half the unit, two interpretations of the same rule. |
Three patterns, three reasonings. None of them is a conclusion; each is an
instruction about which cut to make next.
The trap, and it catches people who know better
The pattern depends entirely on the cut. Split the same 380,000 order lines by person and you may get a uniform shortfall; split them by product category and the same data can be sharply concentrated. Both pictures are true and they point at different causes. So cut the gap at least three ways before drawing any conclusion from its distribution (by who, by what and by when) and report which cuts you made. A pattern reported without its cut is not evidence.
This is also where the gap becomes a direction. Number 08 asks which level a cause sits at, number 09 what kind it is. The distribution answers neither, but it tells you which to open first, which on a four-week analysis is worth a great deal.
Tulser · White Papers · Performance Consulting
An average is a distribution
with the variation taken out.
Tulser · White Papers · Performance Consulting
06 · No number at all
When there is nothing to put on either side
Everything above assumes a measure exists. Often none does, and the honest answer is neither to stall nor to invent one. It is to work out what could be established this month, and to say out loud how little is known meanwhile.
The situation is familiar. A director says service feels slower since the new till system. Chapter leads say volunteers are drifting away. Partners say projects are slipping. Founders say the engineers lack discipline. In each case nobody measures anything, the word at the center of the complaint has never been defined, and somebody has already chosen the training.
Refusing to proceed is not rigor, it is abdication: the request will simply be granted without you. What replaces the missing number is four moves, none of which requires data that does not exist.
| The move | What it does |
|---|---|
| Turn the feeling into something observable | “Service feels slower” is not a measure and cannot become one by being repeated. Ask what somebody would see if it were true: orders taking longer at the pass, a queue at a particular hour, a step done twice. That is countable by Friday by anybody standing there. |
| Find the part of the organization that is fine | Almost always some site, team, chapter or squad is not having the problem. Two restaurants that have not yet received the new till system. One gallery whose hosts get warm comments. The squad that ships clean. That contrast is evidence and it costs nothing, and number 07 is entirely about how to use it. |
| Ask what the data would have to show to change the decision | If the answer is nothing, the decision has already been taken and the analysis is decoration: worth knowing before you start. If the answer is something specific, that is the measure to build, and usually only one is needed. |
| State the confidence, in the report, in words | “On this evidence we would say the cause is probably X; here is what would confirm it and what would overturn it.” A low confidence stated plainly is professional. A high confidence assembled from nothing is the failure this series exists to prevent. |
Four moves for a gap with no number on either side. Not one of them produces a
figure; all four produce something a decision can rest on more safely than a guess dressed as a
finding.
Tulser · White Papers · Performance Consulting
06 · continued
And what not to do when the number is missing
Do not accept a measure you have been told to distrust. Regional managers who say their own audit scores are gamed are telling you something true and useful: number 15 opens on exactly this situation. The answer is not to use the scores anyway because they are the only ones there. It is to say which figures can be trusted, and to work from those.
Do not treat an absence as a finding. That nobody measures volunteer engagement does not establish that engagement has fallen. It establishes that nobody would know. Those are different sentences and only one of them is defensible.
Do not let the deadline manufacture the number. A board that wants “a figure we can show the regulator in sixty days” is asking for a figure, not for the truth. Whatever is produced under that instruction will be quoted for years by people who were not in the room.
And what a thin analysis is still worth
Considerably more than the request it replaces. An analysis that establishes only two sites do not have this problem and here is what they do differently has already produced something the training would never have produced: a comparison, an address, and a testable claim. Number 07 turns that into an instrument, and number 11 says what may be claimed from it afterwards.
The point of the number is never the number. It is that a decision rests on something. Where the number is unavailable, something else has to bear that weight, and saying which is part of the job.
Tulser · White Papers · Performance Consulting
07 · A worked case
The distributor whose target came from a brochure
An industrial parts distributor, 380,000 order lines a year, 41,000 stock items. The figures are illustrative and reconcile from the rates stated with them.
The stated problem was order-line fill rate: 92.0 percent against a target of 98. Six points short, and the proposal on the table was a company-wide stock increase costing $2.9 million in working capital. The board had asked twice why it was taking so long to approve.
Two questions were asked before it was. Where does 98 come from? It came from a competitor’s marketing material, three years old, with no definition of what counted as a line. What does the business actually need? The contracts with the three largest customers specified 95 percent, with service credits below it. Above roughly 96 the carrying cost of the extra stock exceeded the credits it avoided.
| Before and after the second question | |
|---|---|
| The stated gap | 92.0 against 98.0: six points, sourced from a brochure. |
| The derivable gap | 92.0 against 95.5: 3.5 points, derived from the contracts and the carrying cost. Forty percent smaller. |
| In order lines | 3.5 points of 380,000 lines is 13,300 lines a year, not the 22,800 the proposal was sized against. |
The second number was wrong, and it was wrong in the direction that made the
problem look bigger. Nobody had checked because nobody had been asked to derive it.
Tulser · White Papers · Performance Consulting
07 · continued
And then the distribution
The corrected gap was still a gap. What changed the decision was cutting it, and the cut that mattered had never been made.
Fill rate was reported by branch and by month. Nobody had reported it by product category. When somebody did, the 92.0 percent broke into two populations that had nothing to do with each other.
| The cut nobody had made | |
|---|---|
| Fast and medium movers | 80 percent of lines, running at 98.0 percent fill. Already above the derived requirement. |
| Slow-moving spares | 20 percent of lines, running at 68.0 percent. Thirty points below everything else. |
| Weighted | 0.80 × 98.0 + 0.20 × 68.0 = 92.0 percent. The company-wide figure was an average of two unrelated situations. |
| What closing only the spares would do | Slow movers at 90 percent gives 0.80 × 98.0 + 0.20 × 90.0 = 96.4 percent: comfortably past the 95.5 the business needs. |
A concentrated pattern, and it named the population before anybody had visited a
warehouse.
The proposal died on that table. A company-wide stock increase would have spent $2.9 million to raise a figure that was already sufficient across four-fifths of the volume. The finding pointed at 8,200 slow-moving items rather than 41,000, and at whatever it is about slow movers that makes them behave differently: a forecasting method, a reorder rule, a supplier lead time. Which of those it turned out to be is question four, and number 08 is where it gets answered.
What the two questions cost
Deriving the desired level took one afternoon with the contracts and the carrying-cost figures. Cutting the fill rate by category took a morning, because the data already existed and had simply never been grouped that way. Against a $2.9 million proposal, that is the whole argument for asking the second question before signing the first.
Tulser · White Papers · Performance Consulting
08 · The limits
What this does not claim
A method that produces numbers should be plain about what those numbers are not. Four limits.
- A gap is not a cause. It is a measured distance, and it says nothing whatever about why the distance exists. An analysis that stops here has produced a well-quantified complaint. Numbers 08 and 09 do the causal work, and they can fail.
- The distribution is a pointer, not a finding. A uniform shortfall suggests a shared condition; it does not establish one. Every pattern in section 05 is an instruction about where to look next, and each of them can be wrong.
- Every cut can be gerrymandered. Cut a population enough ways and some cut will look concentrated by chance. Decide which cuts are plausible before you make them, report the ones that showed nothing as well as the one that showed something, and treat a cut you went looking for with more suspicion than one that announced itself.
- The desired level is a claim about this organization. Set from what an exemplary performer achieves, it is defensible here and nowhere else. It is not a standard, not a benchmark for the sector, and it should not be quoted outside the analysis that produced it.
Summary
A gap is two numbers and a period. The first can be looked up and is wrong more often than anyone expects; the second has to be derived, and where it comes from decides whether the whole business case survives contact with a skeptic. Then cut it (by who, by what, by when) because the distribution of a shortfall says more about its cause than its size ever will.
Tulser · White Papers · Performance Consulting
Run it yourself
Both numbers, and the cut you have not made
Twenty minutes, on the measure you established in question one. Six lines. A blank is the finding, and line four is the one people cannot fill.
1 · The measure, and who computes it from what
Name the source system and the person. If two functions compute it differently, stop here and reconcile.
2 · Current performance, over four quarters
The value and the period. And one independent trace that says the same thing.
3 · Desired performance
The value. Then the next line, which is the real question.
4 · Walk me from something we already know to that figure
Source one, two, three or four from section 03? If you cannot derive it in thirty seconds, that is your first finding.
5 · The gap, in the unit the business counts
Not in percentage points: in orders, days, cases, lines. Percentage points do not appear on anybody’s report.
6 · Three cuts
By who, by what, by when. Which pattern came out of each, and which cuts showed nothing?
Tulser · White Papers · Performance Consulting
Where this paper sits
Two problems, one method, sixteen papers
| Business problem | Training request | |
|---|---|---|
| Owned by | The manager or director who owns the result. | L&D and the HR business partner. |
| What it prevents | Spending on the wrong intervention: a system, a reorganization, a hire. | Spending on a program that cannot reach the cause. |
| What it returns | The fix that moves the number, chosen on evidence. | The budget and the working hours that were not spent. |
| Method used | The same three analyses and five questions, which is why one capability serves both, and why the diagnosis no longer has to be bought in case by case. | |
One method, two returns, and a standing capability instead of a standing
consultancy line.
Two models carry the method. Gilbert’s six conditions ask what kind of cause; Rummler and Brache’s three levels ask where it sits. Both are sound and this series uses both, and it leads with Gilbert, because his unit is the accomplishment, which is what an organization already counts, and because his six conditions are the categories an organization can actually change.
Tulser · White Papers · Performance Consulting
Where this paper sits · continued
Where the method comes from
Two further pieces close the set and carry no number, because each points at all the numbered papers. Before the guide sits Arets L&D Business Models, the destination piece for the people who receive the requests: four models a learning function can run, and the route from HR-driven to business-driven. Last sits Solutions that cannot work, the field guide, ordered by the sentence that lands on your desk: seventeen forms a performance problem arrives in, each with an address in one of the numbered papers. Three orders in all: the destination you choose, the question you are on, and the form that landed on your desk.
How this series came about
Human performance technology travels the way a craft does: from hand to hand. Vivian Heijnen and Jos Arets learned the analysis from Dennis Mankin, in San Diego, more than twenty years ago, and have kept in contact with him ever since. Both remain grateful to him: for the rigor of the method as he taught it, and for the leadership he has given performance consulting over a long career.
What followed was twenty years of use. Vivian took the method into organizations in the Netherlands and well beyond them, and what accumulates over that many analyses is largely tacit: the cut nobody thought to make, the question that opens a defensive room, the finding that turns out to be an artifact of the data. Making that knowledge explicit, case by case, is what this series is for. Jos wrote it down as it went, in two books and more than forty articles and blog posts, most of them in Dutch, and one seven-part English series, Is AI the bicycle of the mind?, which number 15 grows out of. The books: Liever (g)een training with Boudewijn Overduin, Kostbaar misverstand with Vivian Heijnen, which this series takes a good deal of its thinking from.
None of that is reprinted here. It has been reworked: brought up to date, tested against the research that has appeared since, and dropped where the evidence no longer carries it. Theory that has never met a client is a position; practice that cannot account for itself is a story. This series is what remains when each is held to the other. Performance Consultant AI carries the same discipline to the desk where the decision is actually made.
About the cases. Every worked case in this series comes from our own practice. Names are changed and details altered so that no organization is recognizable, and the arithmetic reconciles. That is said once, here, rather than under each case: client work is confidential, and a case that named anybody would be a breach rather than a proof.
Tulser · White Papers · Performance Consulting
The series
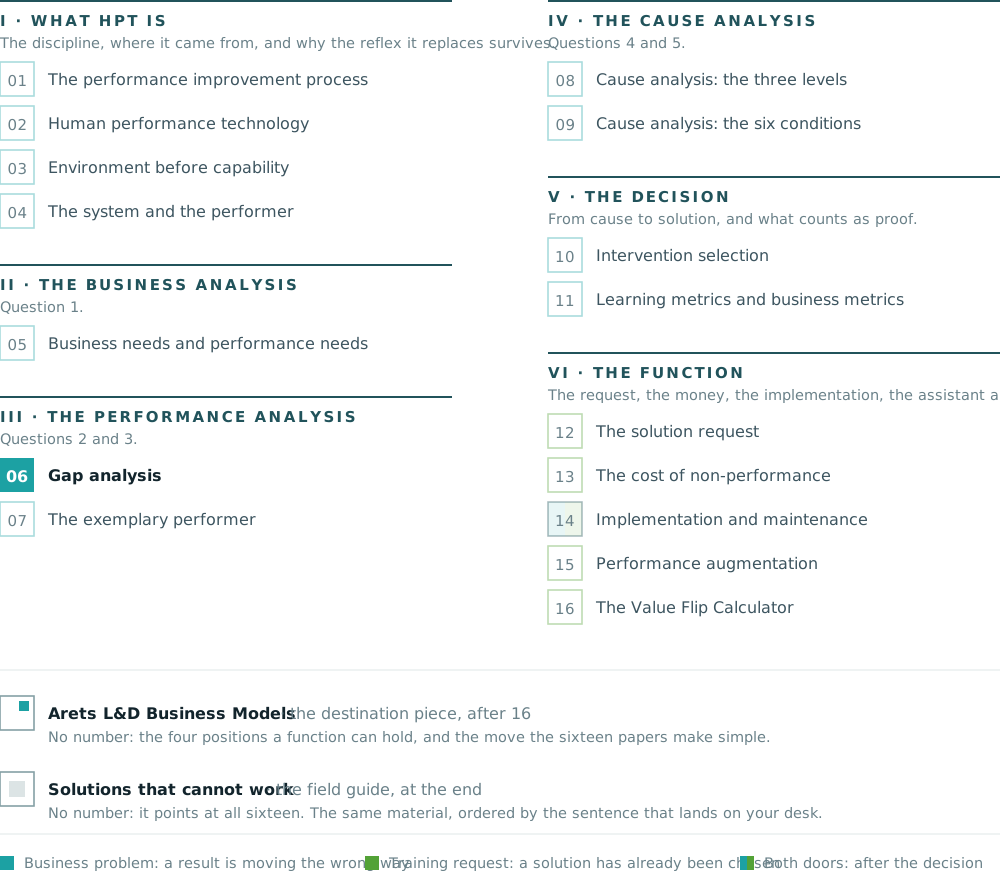
Sixteen papers, six parts
Number 01 is the map and number 02 is the foundation. From number 05 on, every number is depth on exactly one step of the method. The filled block is the paper you are holding; the two unnumbered pieces close the set.
Tulser · White Papers · Performance Consulting
References
Where every claim in this paper comes from
Deming, W. E. (2000). Out of the crisis. MIT Press. (Original work published 1986)
Gilbert, T. F. (1978). Human competence: Engineering worthy performance. McGraw-Hill.
Ordóñez, L. D., Schweitzer, M. E., Galinsky, A. D., & Bazerman, M. H. (2009). Goals gone wild: The systematic side effects of overprescribing goal setting. Academy of Management Perspectives, 23(1), 6–16. https://doi.org/10.5465/amp.2009.37007999
Rummler, G. A., & Brache, A. P. (2013). Improving performance: How to manage the white space on the organization chart (3rd ed.). Jossey-Bass. (Original work published 1990)
The three books named earlier in this paper are listed in full in number 02, so that they do not recur in every reference list.
Tulser · White Papers · Performance Consulting