


White Papers · Performance Consulting
Training request · the money
A solution is on your desk with a price attached.
The cost of non-performance
The Performance Dividend Calculator: what an intervention actually costs, what the gap is costing while nobody closes it, and the two returns a diagnosis produces. Every number in this series is computed here.
No. 13 · © 2026 Tulser
In this paper
The invoice is the smallest number on the page.
The question
Something is about to be approved, and it has a price on it. What does it really cost, what happens to that money if it is aimed at the wrong cause, and what should I require before I sign?
For
Anyone who signs off on an intervention: line directors, operations and finance, OD, quality and improvement staff, HR business partners and heads of L&D.
Read
15 minutes · with a worked case and a one-page instrument.
| 01 | Three prices, one invoice | What an intervention costs before anyone asks whether it works. |
| 02 | The arithmetic of a working day | How the largest number on the page becomes the one nobody books. |
| 03 | Putting a price on a point | Four routes to what the gap is costing, and when each is honest. |
| 04 | What you are betting on | Six conditions make performance possible. A course can reach one. |
| 05 | The refresher that was never needed | A worked case with the money on both sides of the decision. |
| 06 | The dividend, counted twice | The two returns, and the three numbers the calculator puts on one page. |
| 07 | What to require before you sign | Five elements a proposal should carry, and one it usually does not. |
| 08 | What this does not claim | Three limits, because the rest is not credible without them. |
| · | Run it yourself | Price the request in front of you, in ten minutes. |
Tulser · White Papers · Performance Consulting
Every solution has a price.
Only a diagnosis has a return.
Tulser · White Papers · Performance Consulting
01 · The money
Three prices, one invoice
An intervention is bought on one number and paid for with three. The number that reaches the approval paper is almost always the smallest of them.
The first price is direct spend: design, facilitation, licenses, a venue, materials. It arrives as an invoice, it lands in a budget line, and it is the number everyone argues about.
The second is travel and subsistence, where the work is done away from the desk. It is booked, but usually somewhere else: in a travel budget nobody connects to the decision.
The third is working hours. Every participant is paid to be somewhere, and while they are in a room or in a module they are not doing the work the organization is paying them to do. This price is real, it is often the largest of the three, and in our experience it is often not booked anywhere at all.
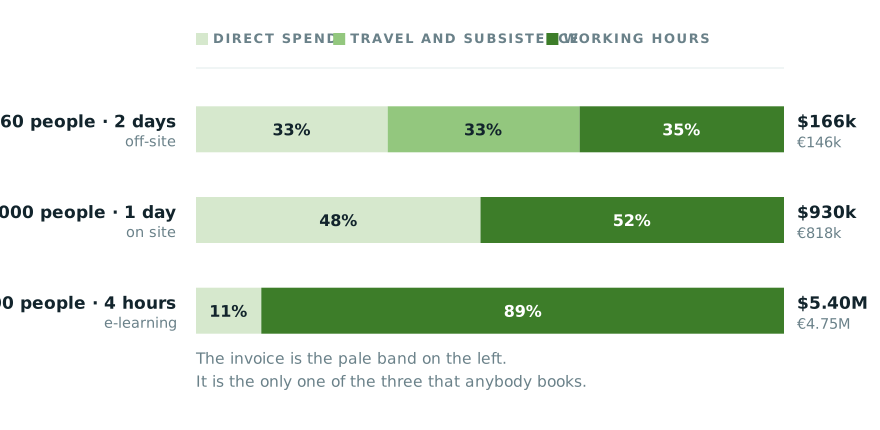
Three interventions, priced in full. The totals differ by a factor of thirty; the
composition is what changes the decision. Illustrative rates are stated in section 02 and every total
reconciles from them.
Tulser · White Papers · Performance Consulting
02 · The arithmetic
The arithmetic of a working day
The calculation is not difficult. It is simply never made, because no single person is accountable for all three lines at once.
| Line | Rate used here | Where it lands today |
|---|---|---|
| Direct spend | $450 (€396) per participant-day in a classroom; $30 (€26) per e-learning license. | The training budget. Visible, argued over, approved. |
| Travel and subsistence | $450 (€396) per participant-day off-site; nothing on site or online. | A travel budget, usually in another function. |
| Working hours | $60 (€53) per hour fully loaded, eight-hour day. | Nowhere. It is absorbed by the line and never appears against the decision. |
Illustrative rates for a professional workforce in a developed market. Substitute
your own; the proportions move very little. Euros throughout at a planning rate of $1 = €0.88: the
ECB reference rate of mid-July 2026, rounded.
60 people · 2 days · off-site
≈ $166k · €146k
Direct $54k · travel $54k · hours $58k. The invoice is a third of the decision.
1,000 people · 1 day · on site
≈ $930k · €818k
Direct $450k · travel nil · hours $480k. Removing the travel does not remove the largest line.
20,000 people · 4h e-learning
≈ $5.40M · €4.75M
Direct $600k · travel nil · hours $4.8M. It looks inexpensive because it is digital.
The third card is where most organizations lose the most and notice the least. A four-hour module rolled out to twenty thousand people costs six hundred thousand dollars to buy and four point eight million dollars to sit through. The purchasing decision is taken on the first figure. The organization pays the second whether or not anyone learns anything.
Tulser · White Papers · Performance Consulting
The invoice arrives once.
The gap invoices every month.
Tulser · White Papers · Performance Consulting
03 · The other side
Putting a price on a point
The full price of an intervention is only half the page. The other half is what the gap is costing while nobody closes it, and unlike the price, that figure is almost never on the table.
Four routes lead to it. Take the first one that applies and stop; what is wanted is a defensible order of magnitude, not a valuation.
| Route | When it applies | Worked in one line |
|---|---|---|
| The transaction | The measure counts units that are sold or delivered. | Win rate up one point on 4,000 bids at $18k margin = $720k (€634k) a year. |
| The failure | The measure counts work that fails and has to be redone. | 1,240 invoices a month rejected and corrected at $46 each = $684k (€602k) a year. |
| The capacity | The measure counts time that people or assets spend. | 18 minutes a shift, 900 staff, 220 shifts, $60 an hour = $3.56M (€3.14M) a year. |
| The exposure | The measure counts events with a regulated or contractual price. | Four late filings a year at a $250k penalty = $1M (€880k) of exposure. |
Every figure above reconciles from the numbers stated beside it. None of them is a
benchmark; they are the structure of the calculation. Euros throughout at a planning rate of $1 = €0.88: the ECB reference rate of mid-July 2026, rounded.
Two disciplines keep this honest. State the rate you used, in the document, next to the answer: a number whose derivation is hidden invites an argument nobody can settle. And be conservative on purpose: if the plausible range is $8 to $14, use $10.60 and say so. An analysis caught being generous once loses every later argument on merit it should have won.
Tulser · White Papers · Performance Consulting
03 · continued
The unit that travels best
One last decision about the figure, and it decides whether the number survives its first change of sponsor.
The unit that travels best
Express the value per point or per tenth of a point of the measure, not only as a total. “Each 0.1 of repeat contact is $254,400 (€224k) a year” survives a change of ambition, a change of scope and a change of sponsor. A single total does not: the moment the target moves, the whole business case has to be rebuilt.
This is where the first question hands over. Number 05 establishes that a measure exists, is owned and is moving; it deliberately stops short of pricing it, because an analysis that reaches for money before it has a measure ends up defending a figure instead of establishing a fact. The measure arrives here, and here it acquires a value.
Tulser · White Papers · Performance Consulting
04 · The odds
What you are betting on
The full price is only half the exposure. The other half is the chance that the money is pointed at something that was never the problem.
Performance is made possible by six conditions. Three sit in the work environment and three sit in the person, and Gilbert’s original ordering has survived four decades of practice largely intact (Gilbert, 1978; Chevalier, 2003). Number 09 sets out what each one looks like on the floor while it is missing; the column that matters here is the second one.
| The condition | Can a course reach it? | What the approval is betting on |
|---|---|---|
| Expectations and feedback | No | That people already know what good looks like, and find out in time to act. |
| Information, tools and time | No | That the data arrives before the decision and the day has room in it. |
| Incentives | No | That nothing in the organization is paying for the other behavior. |
| Process | No | That the work does not stop between two departments. |
| Capacity | No | That the people are right for the work as it is currently designed. |
| Knowledge and skill | Yes | Nothing. This is the one the money can reach. |
One of six. That is the whole exposure in a single line, and the reason the
question “which condition is short?” is worth more than any debate about the design.
This is not an argument that training rarely works. It is an argument about frequency. When the cause is a knowledge or skill shortfall, well-designed learning is exactly right and nothing substitutes for it. When the cause is one of the other five, the best course in the world closes nothing, and the result keeps costing what it was costing.
Tulser · White Papers · Performance Consulting
04 · continued
And the evidence says the same thing
You do not have to take the model on faith. Four independent bodies of evidence converge on where the improvement potential sits, and none of them is a marketing claim.
Pooling eighty-nine studies of training transfer: whether the manager backs it, and what the climate is like in the place people return to, both track how much of a program survives contact with the job, and the work environment weighs six times more heavily on open-ended work than on tightly scripted work (Blume et al., 2010). Support from peers, manager and organization together accounts for roughly a third of the difference in whether training transfers at all (Hughes et al., 2020). And the largest synthesis of behavioral evidence outside work ranks knowledge and general attitudes among the weakest intervention targets, and access to what people need among the strongest (Albarracín et al., 2024): evidence drawn from health and policy behavior, so its extension to work organizations is an inference rather than a finding.
The figures, for anyone who wants them
Blume and colleagues, across 89 studies of transfer: supervisor support correlates with transfer at r = .31, transfer climate at .27, and the work-environment effect is about six times larger for open skills than for closed ones. Hughes and colleagues: peer, supervisor and organizational support together account for roughly a third of the variance.
What this means for an approval decision
Two organizations can run the identical program, with the identical designer and the identical participants, and get different results, because what happens after the room empties is decided by conditions nobody costed. Approving the program without establishing those conditions is not a training decision. It is an uninsured bet on one of six outcomes.
Tulser · White Papers · Performance Consulting
04 · continued
Deming’s half-sentence, and the half that has aged
The most quoted number in this field is still right about where the trouble sits. It is no longer right about who can do something with it.
Deming reached the same conclusion from manufacturing quality half a century ago, and put a number on it that has been quoted ever since: most of what goes wrong belongs to the system rather than to the individual (Deming, 2000, p. 270). He wrote that in an era of strict hierarchy, and assigned the system to management accordingly. That half of the sentence has aged. Much of what surrounds the work is now within reach of the team doing it: the sequence of steps, the checklist, the local rule, the handoff with the team next door, what gets discussed in the stand-up. Work-redesign research finds participative redesign among the approaches with the more promising evidence (Knight & Parker, 2021), and a team that can change its own conditions can act on a finding in a week rather than waiting a quarter for permission.
What has not moved to the team is the rest: capacity at a queue, the incentive scheme, a system contract, the target itself. So the practical reading of Deming in 2026 is two-part. Establish the condition first, then ask who can actually change it, and expect the answer to be the team more often than the sentence in the book suggests, and management still, for the conditions that carry a budget or cross a boundary.
Tulser · White Papers · Performance Consulting
“
94% belongs to the system (responsibility of management), 6% special.
W. Edwards Deming
Out of the Crisis, 2nd ed., 2000, p. 270
Tulser · White Papers · Performance Consulting
05 · A worked case
The refresher that was never needed
A field service operation, forty-two thousand jobs a year, six hundred and twenty technicians. The numbers below are illustrative and reconcile from the rates stated with them.
First-time fix rate fell from 88 to 74 percent over eleven months. Every job that has to be revisited costs about $310 in technician time, vehicle and parts handling. At 88 percent the operation absorbed 5,040 repeat visits a year. At 74 percent it absorbed 10,920. The difference (5,880 extra visits) is $1.82 million (€1.60M) a year, and it had been running for the better part of one.
The service director’s proposal was a two-day technical refresher for all 620 technicians, run regionally so that nobody flew. Priced in full at the rates in section 02, with travel at the regional $250 a day rather than the off-site $450, that is $558k of direct spend, $310k of travel and $595k of technician hours: $1.46 million (€1.29M), and 9,920 technician-hours (some 1,240 working days) taken out of an operation already behind on its jobs.
| What the analysis established | Where it sat |
|---|---|
| The gap | First-time fix 74 percent against a desired 88. Worth $1.82M (€1.60M) a year at $310 (€273) a repeat visit. |
| Who already achieves it | Four technicians held 91 percent under the same conditions, in the same region, with the same training. |
| What they had | A printed crosswalk in the van, made by one of them, between the old fault codes and the new ones. |
| The cause | The parts catalogue moved systems in month three. The ten most-used fault codes were re-mapped. The handheld terminals in the vans still carried the old mapping, so the first visit ordered the wrong part. |
| The condition | Information and tools. Not knowledge, and not skill. |
The four exemplary performers had solved it privately, in a way that never reached
the other 616. That is the ordinary pattern of the evidence.
Tulser · White Papers · Performance Consulting
05 · continued
What the fix cost instead
Republish the mapping to the terminals; print the crosswalk until the release lands. About $40,000 (€35k) and six weeks, most of it one integration engineer.
The refresher was not run. Nobody was told they had been wrong, and nobody was contradicted: the request was reasonable, the technicians were reasonable, and the fault codes were invisible from every desk above the van. What changed is that the money went to the cause instead of to the symptom.
The three numbers a board actually needs
The problem was costing $1.82M (€1.60M) a year. The proposed intervention would have cost $1.46M (€1.29M) and could not have reached the cause. The fix that did reach it cost $40k. Every one of those figures was available before the decision, and none of them was in the paper that came to the table.
It is worth being precise about what the analysis did and did not do. It did not prove that a refresher would have failed; nobody ran the counterfactual. It established that the condition the refresher addresses, knowledge and skill, was not the condition that was short, and it produced a named, testable alternative that could be implemented in six weeks and measured in eight. That is a different kind of claim from a promise, and it is the only kind an analysis is entitled to make.
Tulser · White Papers · Performance Consulting
06 · The return
The dividend, counted twice
A diagnosis pays in two directions at once, and organizations habitually count only one of them, usually the smaller.
| What you keep | What you gain | |
|---|---|---|
| Where it shows | Spend that was about to leave, and hours that were about to be taken out of the line. | The result itself, once the money reaches the cause that was holding it. |
| In the case | $1.46M (€1.29M) not spent; 1,240 working days returned to the operation. | $1.82M (€1.60M) a year recoverable, for a $40k (€35k) fix. |
| Who sees it | Finance, immediately and unambiguously. | The line, over a quarter, in the number they already report. |
| The risk of counting only this one | The function looks like a cost-cutter and gets treated as one. | Nobody notices what did not have to be bought. |
Both columns are the return. A diagnosis that reports only savings has told half
the story, and the less interesting half.
This is what the Performance Dividend Calculator computes
The arithmetic in this paper is not an illustration of an instrument; it is the instrument. The Performance Dividend is the two columns above, expressed against one another: the full price of the proposed intervention, the annual value of the gap it is aimed at, and the cost of the fix that reaches the cause. Three numbers, one page, and every one of them available before the decision rather than after it.
The hours are worth dwelling on, because they are the line that closes the argument with an operations director. Twelve hundred and forty working days is not an abstraction in a service business running behind on its jobs. It is roughly five technicians for a year. Nobody had asked whether the organization could afford to take them out, because nobody had put that question in the same document as the invoice.
Tulser · White Papers · Performance Consulting
07 · The decision
What to require before you sign
You do not have to become an analyst to raise the standard. You have to stop accepting proposals that are missing five elements, and start noticing which one is missing most often.
| Require | What good looks like |
|---|---|
| 1 · The result | A number the organization already counts, with a value on a point of it. Not a sentiment, not a survey score. |
| 2 · The gap | Current performance and desired performance, both measured. Desired is what the business needs and someone can reach, not perfection. |
| 3 · The exemplary performer | Someone, somewhere, already gets the result under the same conditions. Name them, or say plainly that nobody does. |
| 4 · The cause | Placed at a level (organization, process or performer) and attached to one of the six conditions, with the evidence for it. |
| 5 · The full price | Direct spend plus travel plus working hours, set against the annual value of the gap. All three lines, on one page. |
Each of these is one paper in this series. Number 05 takes the first, 06 the
second, 07 the third, and 08 and 09 the fourth.
And the sixth, which is almost never there
How confident is the diagnosis, and what would raise that confidence? A proposal that cannot say where its own evidence runs out is asking you to carry a risk it has not named. The honest form is short: this is what we established, this is what we inferred, and this is the one check that would settle it.
None of this slows a decision down by more than days. The analysis behind the case in section 05 took under a week, most of it spent riding along with four technicians and reading a release note.
Tulser · White Papers · Performance Consulting
08 · The limits
What this does not claim
An argument this convenient for one side deserves its boundaries stated first. Three of them, plainly.
- It is not an argument against training. Where the cause genuinely is a shortfall in knowledge or skill, well-designed learning is exactly right and nothing substitutes for it. The claim here is about frequency, not about value.
- The rates are illustrative. The figures in section 02 are stated so that every total in this paper can be recomputed, not because they are your rates. Substitute your own, and your own exchange rate with them. The proportions move very little, and the argument does not depend on either.
- An analysis is not a guarantee. It establishes what is causing a gap and what would close it. It does not promise the fix will be implemented, or implemented well, and it cannot protect a decision from being overruled for reasons that were never about the evidence.
Summary
The question is not whether the proposed intervention is any good. It is whether anyone has established what is wrong, and whether the money is pointed at that. Those are answerable in days, and they are answerable before the money leaves.
Tulser · White Papers · Performance Consulting
Run it yourself
Price the request in front of you
Ten minutes, on the proposal on your desk now. Answer these five and you have the input a diagnosis needs. Leave one blank and you have found the first thing to establish.
1 · The full price, all three lines
Direct spend, travel, and participants × hours × loaded rate. Write all three, then the total.
2 · The result it is meant to move
Which number, from what to what, and what is a point of it worth per year?
3 · Who already achieves it
Name one person, shift, site or unit getting the result under the same conditions.
4 · Which of the six conditions is short
Expectations, information and tools, incentives, process, capacity, knowledge, and the evidence for your answer.
5 · What the gap is costing while you decide
The annual value of the gap, divided by twelve. That is the price of another month of not knowing.
Tulser · White Papers · Performance Consulting
Where this paper sits
Two problems, one method, sixteen papers
| Business problem | Training request | |
|---|---|---|
| Owned by | The manager or director who owns the result. | L&D and the HR business partner. |
| What it prevents | Spending on the wrong intervention: a system, a reorganization, a hire. | Spending on a program that cannot reach the cause. |
| What it returns | The fix that moves the number, chosen on evidence. | The budget and the working hours that were not spent. |
| Method used | The same three analyses and five questions, which is why one capability serves both, and why the diagnosis no longer has to be bought in case by case. | |
One method, two returns, and a standing capability instead of a standing
consultancy line.
Two models carry the method. Gilbert’s six conditions ask what kind of cause; Rummler and Brache’s three levels ask where it sits. Both are sound and this series uses both, and it leads with Gilbert, because his unit is the accomplishment, which is what an organization already counts, and because his six conditions are the categories an organization can actually change.
Tulser · White Papers · Performance Consulting
Where this paper sits · continued
Where the method comes from
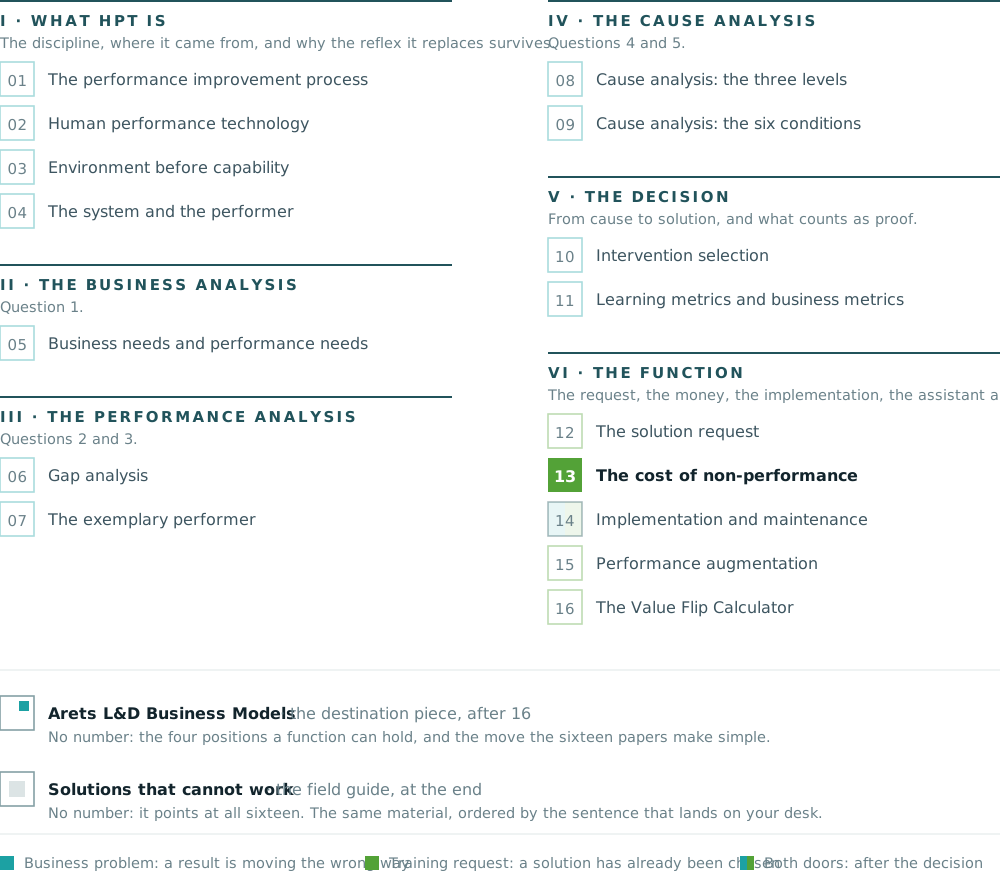
Two further pieces close the set and carry no number, because each points at all the numbered papers. Before the guide sits Arets L&D Business Models, the destination piece for the people who receive the requests: four models a learning function can run, and the route from HR-driven to business-driven. Last sits Solutions that cannot work, the field guide, ordered by the sentence that lands on your desk: seventeen forms a performance problem arrives in, each with an address in one of the numbered papers. Three orders in all: the destination you choose, the question you are on, and the form that landed on your desk.
How this series came about
Human performance technology travels the way a craft does: from hand to hand. Vivian Heijnen and Jos Arets learned the analysis from Dennis Mankin, in San Diego, more than twenty years ago, and have kept in contact with him ever since. Both remain grateful to him: for the rigor of the method as he taught it, and for the leadership he has given performance consulting over a long career.
What followed was twenty years of use. Vivian took the method into organizations in the Netherlands and well beyond them, and what accumulates over that many analyses is largely tacit: the cut nobody thought to make, the question that opens a defensive room, the finding that turns out to be an artifact of the data. Making that knowledge explicit, case by case, is what this series is for. Jos wrote it down as it went, in two books and more than forty articles and blog posts, most of them in Dutch, and one seven-part English series, Is AI the bicycle of the mind?, which number 15 grows out of. The books: Liever (g)een training with Boudewijn Overduin, Kostbaar misverstand with Vivian Heijnen, which this series takes a good deal of its thinking from.
None of that is reprinted here. It has been reworked: brought up to date, tested against the research that has appeared since, and dropped where the evidence no longer carries it. Theory that has never met a client is a position; practice that cannot account for itself is a story. This series is what remains when each is held to the other. Performance Consultant AI carries the same discipline to the desk where the decision is actually made.
About the cases. Every worked case in this series comes from our own practice. Names are changed and details altered so that no organization is recognizable, and the arithmetic reconciles. That is said once, here, rather than under each case: client work is confidential, and a case that named anybody would be a breach rather than a proof.
Tulser · White Papers · Performance Consulting
The series
Sixteen papers, six parts
Number 01 is the map and number 02 is the foundation. From number 05 on, every number is depth on exactly one step of the method. The filled block is the paper you are holding; the two unnumbered pieces close the set.
Tulser · White Papers · Performance Consulting
References
Where every claim in this paper comes from
Albarracín, D., Fayaz-Farkhad, B., & Granados Samayoa, J. A. (2024). Determinants of behaviour and their efficacy as targets of behavioural change interventions. Nature Reviews Psychology, 3(6), 377–392. https://doi.org/10.1038/s44159-024-00305-0
Blume, B. D., Ford, J. K., Baldwin, T. T., & Huang, J. L. (2010). Transfer of training: A meta-analytic review. Journal of Management, 36(4), 1065–1105. https://doi.org/10.1177/0149206309352880
Chevalier, R. (2003). Updating the behavior engineering model. Performance Improvement, 42(5), 8–14. https://doi.org/10.1002/pfi.4930420504
Deming, W. E. (2000). Out of the crisis (2nd ed.). The MIT Press. (Original work published 1986)
Knight, C., & Parker, S. K. (2021). How work redesign interventions affect performance: An evidence-based model from a systematic review. Human Relations, 74(1), 69–104. https://doi.org/10.1177/0018726719865604
Gilbert, T. F. (1978). Human competence: Engineering worthy performance. McGraw-Hill.
Harless, J. H. (1985). Invited address: Performance technology and other popular myths. Performance + Instruction, 24(6), 4–6. https://doi.org/10.1002/pfi.4150240603
Hughes, A. M., Zajac, S., Woods, A. L., & Salas, E. (2020). The role of work environment in training sustainment: A meta-analysis. Human Factors, 62(1), 166–183. https://doi.org/10.1177/0018720819845988
Rummler, G. A., & Brache, A. P. (2013). Improving performance: How to manage the white space on the organization chart (3rd ed.). Jossey-Bass. (Original work published 1990)
The three books named earlier in this paper are listed in full in number 02, so that they do not recur in every reference list.
Tulser · White Papers · Performance Consulting